. 2022 May 6;12(9):1579.
doi: 10.3390/nano12091579.

Highly Sensitive Nanomagnetic Quantification of Extracellular Vesicles by Immunochromatographic Strips: A Tool for Liquid Biopsy

Affiliations

Highly Sensitive Nanomagnetic Quantification of Extracellular Vesicles by Immunochromatographic Strips: A Tool for Liquid Biopsy

Vera A Bragina et al. Nanomaterials (Basel). .

Abstract

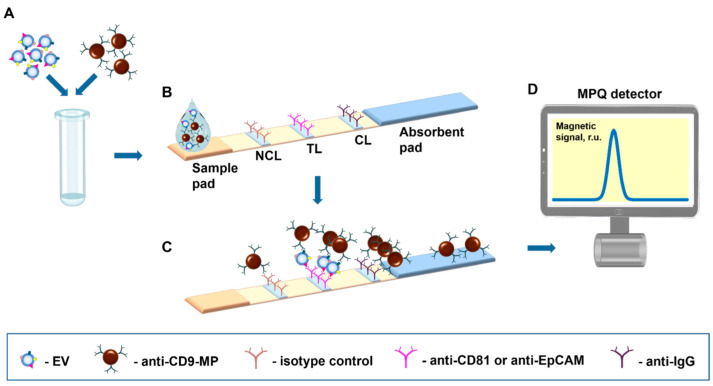
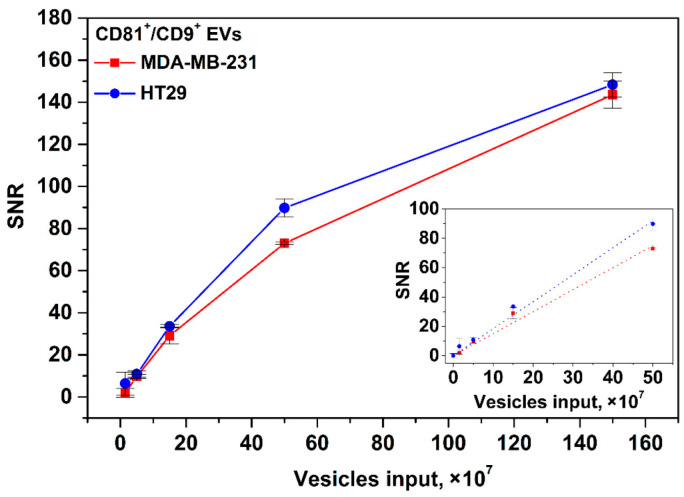
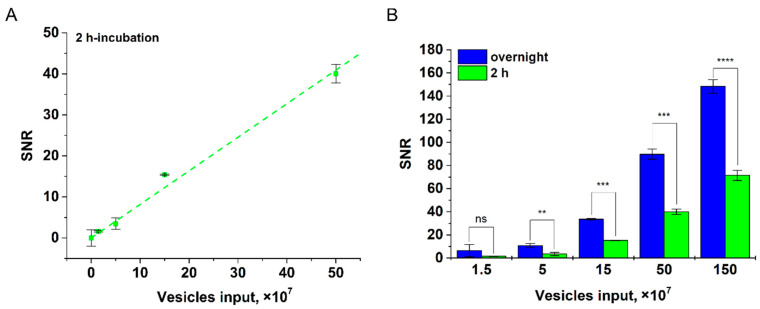
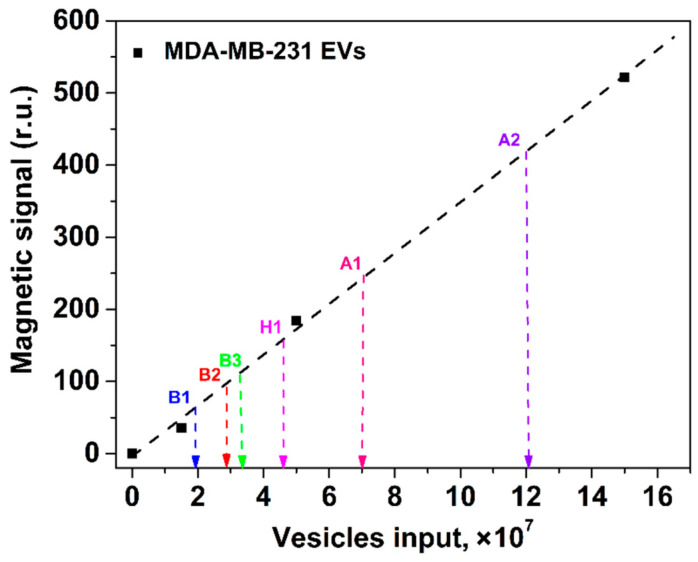
Extracellular vesicles (EVs) are promising agents for liquid biopsy-a non-invasive approach for the diagnosis of cancer and evaluation of therapy response. However, EV potential is limited by the lack of sufficiently sensitive, time-, and cost-efficient methods for their registration. This research aimed at developing a highly sensitive and easy-to-use immunochromatographic tool based on magnetic nanoparticles for EV quantification. The tool is demonstrated by detection of EVs isolated from cell culture supernatants and various body fluids using characteristic biomarkers, CD9 and CD81, and a tumor-associated marker-epithelial cell adhesion molecules. The detection limit of 3.7 × 10⁵ EV/µL is one to two orders better than the most sensitive traditional lateral flow system and commercial ELISA kits. The detection specificity is ensured by an isotype control line on the test strip. The tool's advantages are due to the spatial quantification of EV-bound magnetic nanolabels within the strip volume by an original electronic technique. The inexpensive tool, promising for liquid biopsy in daily clinical routines, can be extended to other relevant biomarkers.

Keywords: antibody-functionalized magnetic nanoparticles; breast and ovarian cancers; extracellular vesicles; immunochromatographic test strips; magnetic particle quantification; nonlinear magnetization.


Conflict of interest statement

P.I.N. is a named inventor of patents on MPQ.

Figures

Figure 1
Figure 1
Scheme of the nanomagnetic IC tool for EV quantification. (A) Samples are incubated with magnetic nanoparticles functionalized with an EV-specific antibody. (B) Test strip design. (C) Immunochemical reactions during the migration along the test strip of the sample containing EVs–anti-CD9-MP complexes. (D) The test strip is inserted into an MPQ detector to register magnetic signals from the nanolabels.
Figure 2
Figure 2
Characterization of EVs purified from HT29 and MDA MB-231 cell culture supernatants. (A,C) TEM images and (B,D) corresponding NTA/TEM particle size distributions. The squares indicate mean values, while the box-and-whisker plots show 5%, 25%, 50%, 75%, and 95% percentiles.
Figure 3
Figure 3
Analysis of binding of PE-anti-CD81-stained HT29 EVs to Cy5-anti-CD9-MP with imaging flow cytometry. (A) PE intensity histograms. Fitting of the histogram of the Cy5-anti-CD9-MP-bound EVs stained with PE-anti-CD81 with two Gaussian distributions are shown by dashed lines (grey—unbound Cy5-Anti-CD9-MP; black—EV–Cy5-Anti-CD9-MP immune complexes). (B) Representative images of the formed immune complexes between Cy5-anti-CD9-MP and PE-anti-CD81-labelled EVs in Cy5, PE, and side scatter (SSC) channels.
Figure 4
Figure 4
EV quantification by the developed nanomagnetic IC tool. (A) Photograph of the IC strips for HT29 EVs with anti-CD81 as capture antibody and anti-CD9 as tracer antibody. (B) Signal distribution along the IC strip at different EV inputs (data for CD81+/CD9+ HT29 EVs).
Figure 5
Figure 5
Calibration plots for CD81+/CD9+ HT29 and MDA-MB-231 EVs. Insert: zoomed linear fitting plots for low EV input range.
Figure 6
Figure 6
Detection of CD81+/CD9+ HT29 EVs at various incubation times. (A) Linear fitting plot at 2 h incubation. (B) Dependences of SNR upon incubation time (2 h and overnight) with different HT29 EV inputs; statistical significance determined using the unpaired two-tailed Student’s t-test is denoted by asterisks (ns—p > 0.05, **—p < 0.01, ***—p < 0.001, ****—p < 0.0001).
Figure 7
Figure 7
Quantification of EVs isolated from clinical samples with the proposed nanomagnetic IC tool using the calibration plot (shown by the black dashed line) for CD81+/CD9+ MDA-MB-231 EVs. Clinical samples: serum from patients with breast cancer (B1–B3), a healthy donor (H1), and ascites fluids of patients with ovarian cancer (A1, A2).

References

    1. Soda N., Rehm B.H.A., Sonar P., Nguyen N.-T., Shiddiky M.J.A. Advanced liquid biopsy technologies for circulating biomarker detection. J. Mater. Chem. B. 2019;7:6670–6704. doi: 10.1039/C9TB01490J. - DOI - PubMed
    1. Vaidyanathan R., Soon R.H., Zhang P., Jiang K., Lim C.T. Cancer diagnosis: From tumor to liquid biopsy and beyond. Lab Chip. 2019;19:11–34. doi: 10.1039/C8LC00684A. - DOI - PubMed
    1. Zhou B., Xu K., Zheng X., Chen T., Wang J., Song Y., Shao Y., Zheng S. Application of exosomes as liquid biopsy in clinical diagnosis. Signal Transduct. Target. Ther. 2020;5:144. doi: 10.1038/s41392-020-00258-9. - DOI - PMC - PubMed
    1. Colombo M., Raposo G., Théry C. Biogenesis, secretion, and intercellular interactions of exosomes and other extracellular vesicles. Annu. Rev. Cell Dev. Biol. 2014;30:255–289. doi: 10.1146/annurev-cellbio-101512-122326. - DOI - PubMed
    1. Skog J., Würdinger T., van Rijn S., Meijer D.H., Gainche L., Sena-Esteves M., Curry W.T., Carter B.S., Krichevsky A.M., Breakefield X.O. Glioblastoma microvesicles transport RNA and proteins that promote tumour growth and provide diagnostic biomarkers. Nat. Cell Biol. 2008;10:1470–1476. doi: 10.1038/ncb1800. - DOI - PMC - PubMed

LinkOut - more resources