

Oxygen Uptake Measurements and Rate of Perceived Exertion during a Marathon
- PMID: 35565153
- PMCID: PMC9104840
- DOI: 10.3390/ijerph19095760
Oxygen Uptake Measurements and Rate of Perceived Exertion during a Marathon
Abstract
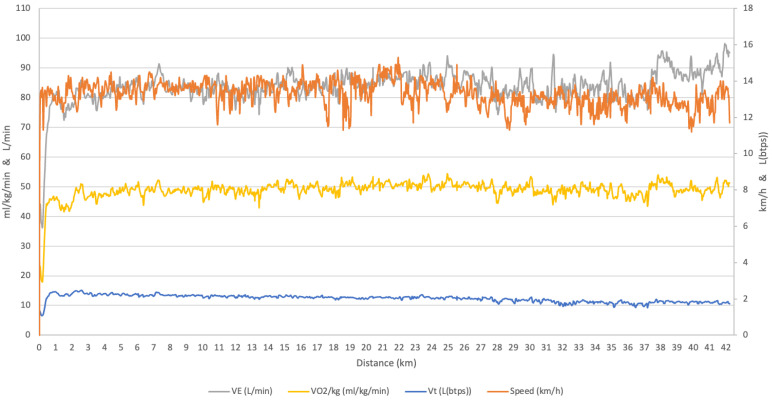
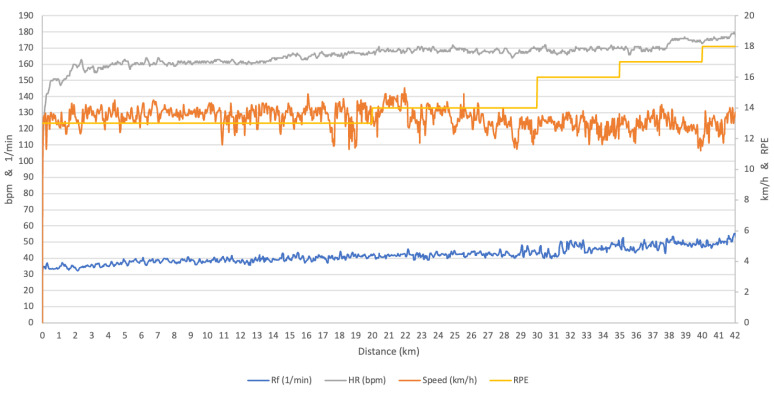
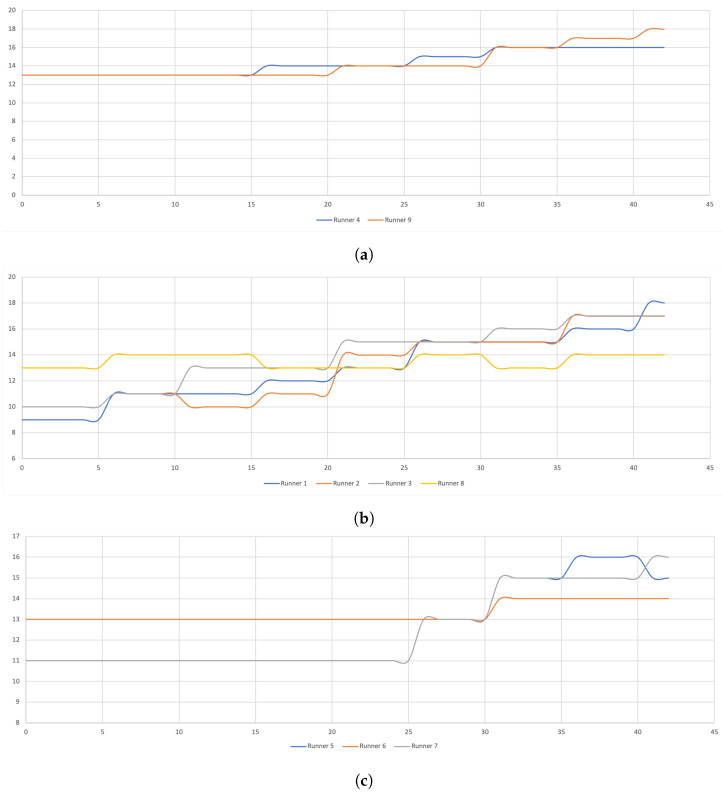
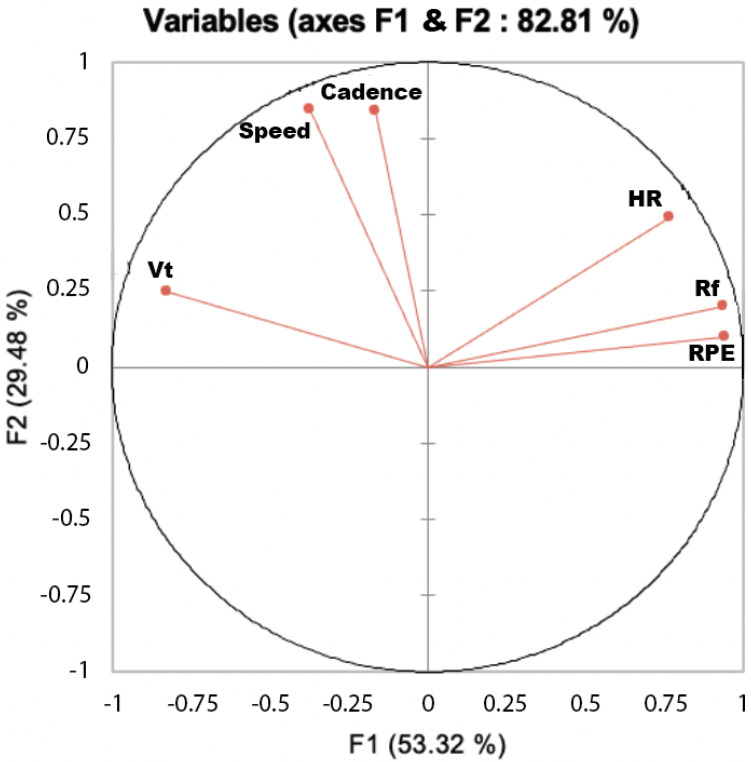
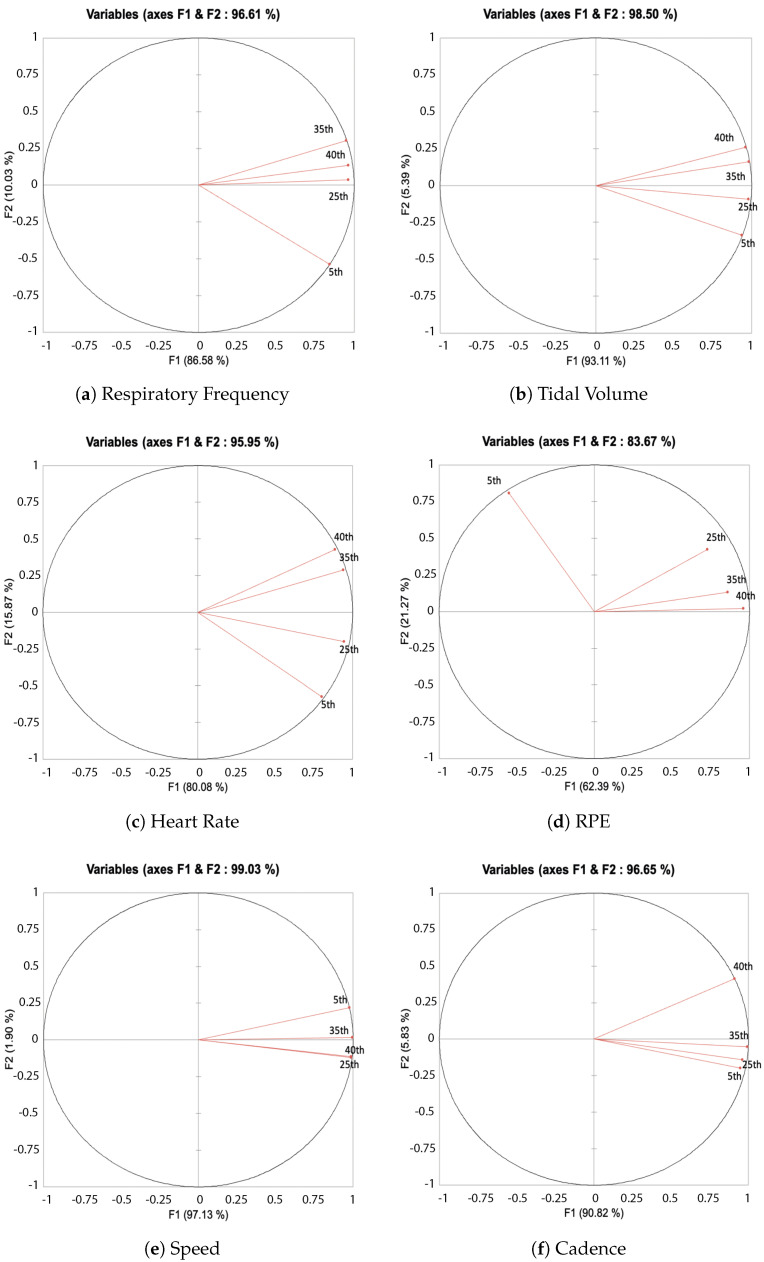
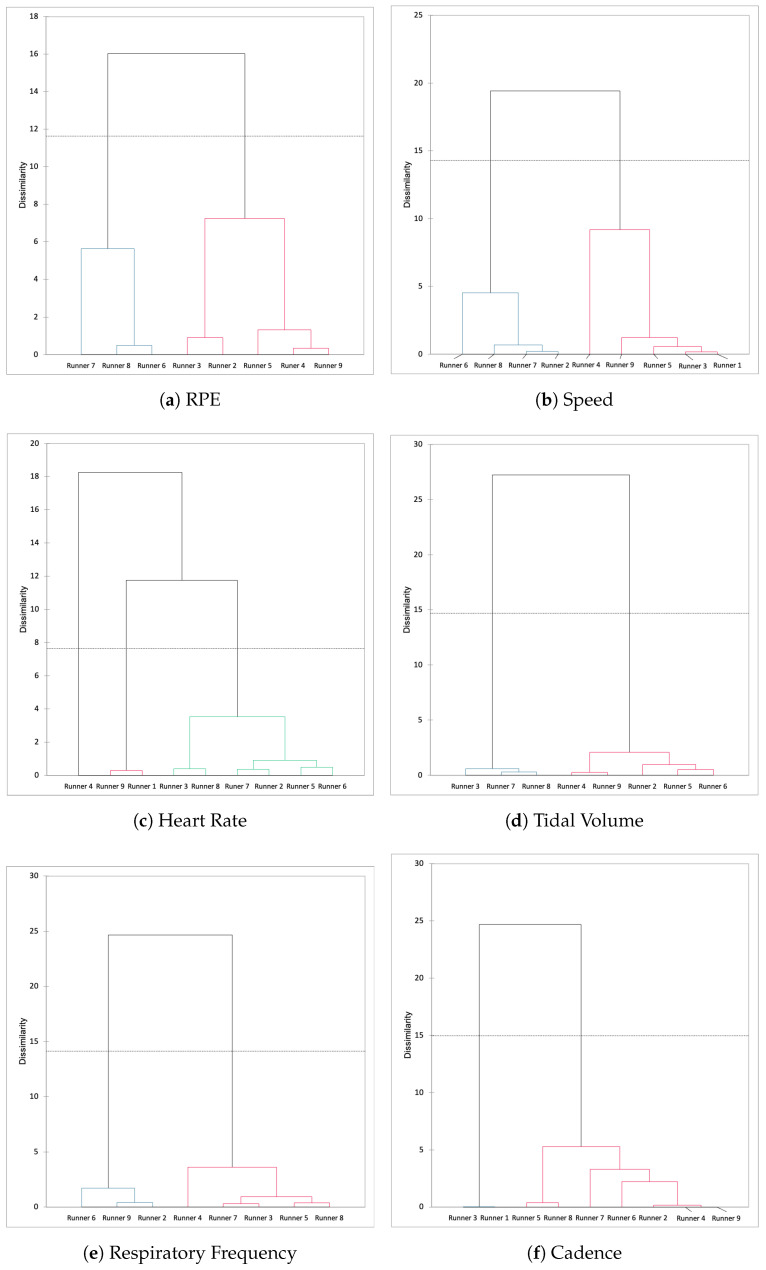
Although the marathon race has been democratized, it remains complex due to the famous "hitting the wall" phenomenon after the 25th km. To characterize this "wall" from a physiological and Rate of Perceived Exertion (RPE) perspective in recreational marathon runners, we report first continuous breath-by-breath gas exchange measurements during an actual marathon race. In order to test the hypothesis that RPE could be a candidate for controlling the marathon pace, this study examined the relationship between RPE and the physiological variables time course throughout a marathon. Only the respiratory frequency and heart rate increased progressively during the race in all the runners, while the oxygen uptake and ventilatory rate followed different kinetics according the individuals. However, the indexation of the physiological parameters and speed by RPE showed the same decreased tendency for all the runners. In conclusion, these results suggest that running a marathon must be self-paced with the RPE.
Keywords: cardiovascular drift; endurance running; hitting the wall; physiology of exercise; positive split; self-pace.
Conflict of interest statement
The authors declare no conflict of interest.
Figures
References
-
- Run Repeat. [(accessed on 9 March 2022)]. Available online: https://runrepeat.com/state-of-running.
-
- Latta S. Hitting the wall: If you understand the scientific reasons behind “the wall”, you should be able to avoid it. Marathon Beyond. 2003;7:61–72.
-
- Berndsen J., Lawlor A., Smyth B. Exploring the Wall in Marathon Running. J. Sport. Anal. 2020;6:173–186. doi: 10.3233/JSA-200354. - DOI
-
- Smyth B. Fast Starters and Slow Finishers: A Large-Scale Data Analysis of Pacing at the Beginning and End of the Marathon for Recreational Runners. J. Sport. Anal. 2018;4:229–242. doi: 10.3233/JSA-170205. - DOI
MeSH terms
Substances
LinkOut - more resources
Full Text Sources
