. 2022 Apr 19;14(9):2057.
doi: 10.3390/cancers14092057.

The Quasimesenchymal Pancreatic Ductal Epithelial Cell Line PANC-1-A Useful Model to Study Clonal Heterogeneity and EMT Subtype Shifting

Affiliations

The Quasimesenchymal Pancreatic Ductal Epithelial Cell Line PANC-1-A Useful Model to Study Clonal Heterogeneity and EMT Subtype Shifting

Hendrik Ungefroren et al. Cancers (Basel). .

Abstract

Intratumoral heterogeneity (ITH) is an intrinsic feature of malignant tumors that eventually allows a subfraction of resistant cancer cells to clonally evolve and cause therapy failure or relapse. ITH, cellular plasticity and tumor progression are driven by epithelial-mesenchymal transition (EMT) and the reverse process, MET. During these developmental programs, epithelial (E) cells are successively converted to invasive mesenchymal (M) cells, or back to E cells, by passing through a series of intermediate E/M states, a phenomenon termed E-M plasticity (EMP). The induction of MET has clinical potential as it can block the initial EMT stages that favor tumor cell dissemination, while its inhibition can curb metastatic outgrowth at distant sites. In pancreatic ductal adenocarcinoma (PDAC), cellular models with which to study EMP or MET induction are scarce. Here, we have generated single cell-derived clonal cultures of the quasimesenchymal PDAC-derived cell line, PANC-1, and found that these differ strongly with respect to cell morphology and EMT marker expression, allowing for their tentative classification as E, E/M or M. Interestingly, the different EMT phenotypes were found to segregate with differences in tumorigenic potential in vitro, as measured by colony forming and invasive activities, and in circadian clock function. Moreover, the individual clones the phenotypes of which remained stable upon prolonged culture also responded differently to treatment with transforming growth factor (TGF)β1 in regard to regulation of growth and individual TGFβ target genes, and to culture conditions that favour ductal-to-endocrine transdifferentiation as a more direct measure for cellular plasticity. Of note, stimulation with TGFβ1 induced a shift in parental PANC-1 cultures towards a more extreme M and invasive phenotype, while exposing the cells to a combination of the proinflammatory cytokines IFNγ, IL1β and TNFα (IIT) elicited a shift towards a more E and less invasive phenotype resembling a MET-like process. Finally, we show that the actions of TGFβ1 and IIT both converge on regulating the ratio of the small GTPase RAC1 and its splice isoform, RAC1b. Our data provide strong evidence for dynamic EMT-MET transitions and qualify this cell line as a useful model with which to study EMP.

Keywords: EMT; MET; PANC-1; epithelial–mesenchymal plasticity; intratumoral heterogeneity; pancreatic ductal adenocarcinoma; phenotype; proinflammatory cytokines; transdifferentiation; transforming growth factor β.


Conflict of interest statement

The authors declare no conflict of interest.

Figures

Figure 1
Figure 1
Heterogeneity and phenotypic stability of single cell-derived clones of PANC-1. (A) Immunoblot analysis of the EMT-related biomarkers ECAD, VIM and RAC1 in single cell-derived clones of PANC-1. The housekeeping protein GAPDH served as a loading control. The blots shown are representative of 5–7 samples per clone taken at different time points during continuous culture. The graph below the blot depicts the relative ratios of ECAD:VIM band intensities derived from densitometric readings. The numbers on the right-hand side denote molecular weights in kDa. (B) As in (A), except that single cell-derived clones of BxPC-3 cells were analyzed. (C) ECAD and VIM expression in subclones of PANC1-clones P3D2 and P3D10. Single cell-derived subclones of P3D2 and P3D10 were generated by limited dilution and monitored for ECAD and VIM expression, as described in (A). The relative ECAD:VIM ratios of band intensities from the various subclones are presented underneath the blots.
Figure 2
Figure 2
Heterogeneity of individual PANC-1 clones in invasive activities and stemness features. (A) Real-time cell migration assays of six individual clones of PANC-1. (B) As in (A), except that the migration assays were performed with four individual clones of BxPC-3. Data in (A,B) are the mean ± SD of quadruplicate wells and are representative of three assays. (C) CFA of the indicated PANC-1 clones. Four-hundred cells of each clone were seeded per six-well plates and incubated for 10–12 d, after which the colonies formed were fixed and stained and the colonies consisting of >50 cells were counted manually under a microscope. Data are the means ± SD of triplicate wells. The asterisks indicate significance. ** p < 0.01 (two-tailed unpaired Student’s t-test).
Figure 3
Figure 3
Heterogeneity in cellular responses of individual PANC-1 clones to stimulation with TGFβ1. (A) The indicated PANC-1 clones were treated for six days with TGFβ1 in standard growth medium prior to the resazurin assay. Data are the means ± SD of three independent assays. The number of dead cells in all assays was <1%. (B) Response of SERPINE1 to stimulation with TGFβ1. Cells analyzed in (A) were subjected to RNA isolation and qPCR for SERPINE1. Data shown are the mean ± SD of three assays. (C) Immunoblot analysis of SNAIL, and ECAD as control, of the indicated PANC-1 clones after a 72 h treatment with TGFβ1. Quantitative data depicted as graphs underneath the blots (mean ± SD of three technical replicates) were derived from densitometric readings of signal intensities normalized to total protein loading and are representative of three experiments. (D) Basal and TGFβ1-induced expression of SLUG. The five PANC-1 clones and parental cells from (C) were subjected to qPCR for SNAIL2. Data are representative of three assays and are the mean ± SD of triplicate wells. Asterisks (*) denote a significant difference.
Figure 4
Figure 4
PANC-1 clones and heterogeneity with respect to deTD and circadian rhythmicity. (A) The indicated PANC-1 clones were subjected to deTD culture for 5 days in normal growth medium supplemented with 100 ng/mL IFNγ, 25 ng/mL IL1β and 50 ng/mL TNFα (TDC-IIT). Following lysis and RNA extraction, INS and NEUROG3 expression was determined by qPCR and Ct values normalized with those for GAPDH. The assay shown (means ± SD of three replicates) is representative of three experiments. Significant differences (p < 0.05) are marked by asterisks (*). (B) Bmal1::Luc bioluminescence reporter assays in parental (par) PANC-1 cells and subclones. Each clone is presented separately. For PANC-1, each applied synchronization treatment is depicted in a different color, as indicated (dexa: black; forskolin: blue; horse serum shock: red). The 24 h baseline subtracted bioluminescence data are shown as mean ± SEM. Data are pooled from two independent experiments with 4–8 replicates each. Dampened sine curves were fitted for rhythmic clones for rhythm parameter determination (Figure S7).
Figure 5
Figure 5
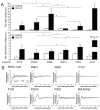
PANC-1 cells can be shifted towards a more mesenchymal and invasive phenotype by activation of a TGFβ transcriptional program. (A) Parental PANC-1 cultures were treated with TGFβ1 for 24 h followed by qPCR analysis of CK19, CLDN7, ECAD and EpCAM. The data shown (means ± SD of three replicates) are representative of three experiments. Significant differences (p < 0.05) are marked by asterisks (*). (B) As in (A), except that primers for BGN, PAI-1, SNAIL1 and SLUG were used. Ct values were normalized with those for GAPDH in the same samples. (C) PANC-1 cells were subjected to real-time cell invasion assay on an xCELLigence platform in the presence or absence of TGFβ1 (5 ng/mL). Data are representative of three assays and are the means ± SD of triplicate wells. The asterisk marks the earliest time point with significant differences between TGFβ1-treated and untreated control cells. ** p < 0.01, *** p < 0.001.
Figure 6
Figure 6
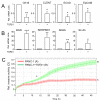
PANC-1 and MIA PaCa-2 cells can be shifted towards a more epithelial phenotype. (A) PANC-1 cells were subjected to TD culture with IIT (TDC-IIT) for 72 h followed by immunoblot analysis of the indicated proteins. The assay shown (means ± SD of three replicates) is representative of three experiments. The graphs to the right show data quantification from three assays (n = 3) based on densitometric readings of signal intensities normalized to the total protein content of the corresponding lane (Figure S12). Significant differences (p < 0.05) are marked by asterisks (*). (B) As in (A), except that MIA PaCa-2 cells were used. Again, signal intensities of RAC1 and VIM were normalized to values for total protein loading in the same lane (Figure S12). (C) As in (A), except that CLDN4 was detected and signal quantification shown in the graph on the right-hand side. (D) QPCR analyses of the indicated genes in MIA PaCa-2 and PANC-1 cells. Values were normalized with the housekeeping genes GAPDH or TBP in the same samples. Data are the means ± SD of three experiments (n = 3). Significant differences (p < 0.05) are marked by asterisks (*). The assays shown are representative of three experiments. Significant differences are marked by asterisks. *, p < 0.05, **, p < 0.01, *** p < 0.001. (E) PANC-1 cells were pretreated with IIT for 48 h and thereafter subjected to real-time cell invasion assay (in the absence of IIT) using Matrigel as barrier. Data are the means ± SD of three parallel wells and are representative of three assays. The asterisk (*) marks the time point at which data first become significant.
Figure 7
Figure 7
Treatment with TGFβ1 downregulates endogenous but not ectopically expressed RAC1b in PANC-1 cells. (A) PANC-1 cells were treated or not for 3 d with 5 ng/mL of TGFβ1 in the absence or presence of vehicle (DMSO) or the indicated small molecule inhibitors, followed by lysis and sequential immunoblotting of RAC1b, RAC1 and HSP90 as a loading control. Data quantification by densitometric analysis of band intensities plotted relative to untreated control cells represents the mean ± SD of three experiments. Asterisks (*) indicate a significant difference. The horizontal lines between lanes 4 and 5 of the blots denote removal of irrelevant lanes. (B) PANC-1 cells were treated, or not, for 120 h with the indicated concentrations of rec. human (rh) TGFβ1 followed by sequential immunoblotting of RAC1b, RAC1, SNAIL and ECAD. The graph below the blot provides quantitative data for RAC1b derived from densitometric readings of RAC1b and HSP90 (mean ± SD, n = 3). (C) PANC1-1 cells ectopically expressing HA-tagged RAC1b were left untreated or were treated for 3 d or 10 d with TGFβ1 followed by immunoblot analysis of RAC1b, SNAIL and GAPDH as loading control. Please note unaltered expression of ectopic RAC1b and induction of SNAIL as a control for TGFβ1 biological activity. Data are the means ± SD of three replicates and are representative of three experiments performed in total. (D) Effect of a 24 h treatment with TGFβ1 on RAC1b (left-hand graph) or RAC1 (right-hand graph) steady-state mRNA levels as measured by qPCR (mean ± SD of three experiments). The asterisk indicates a significant difference; n.s., not significant. (E) PANC-1 cells were subjected to TDC-IIT for 72 h followed by immunoblot analysis of RAC1 and RAC1b. The assay shown (means ± SD of three replicates each) is representative of three experiments. The graph to the right shows RAC1b signal quantification based on densitometric readings from three assays (n = 3). The asterisk (*) denotes a significant difference (p < 0.05).
Figure 8
Figure 8
Cartoon illustrating heterogeneity in PANC-1 cells with respect to EMT/MET phenotypes. (A) Principal induction of EMT (red lines), e.g., by growth factors such as TGFβ, or induction of MET (blue lines), e.g., by proinflammatory cytokines INFγ, IL1β and TNFα (IIT), and the associated changes in marker expression (↑ and ↓ denote up- and downregulation, respectively). (B) Schematic representation of the different EMT phenotypes present in parental cultures of PANC-1 based on marker expression and functional properties of the six clones. The stippled lines denote the principal ability of the hybrid phenotypes for further dedifferentiation towards a more complete/extreme M phenotype, or redifferentiation to the previous E state. With regard to the latter event, it is currently unclear whether IIT treatment can reprogram MIA PaCa-2 cells to an extreme E phenotype or merely to one of several hybrid E/M states (denoted by question marks). It also remains to be investigated whether all of the hybrid E/M phenotypes present in PANC1 cultures respond to TGFβ1 or IIT with induction of these differentiation events and whether their concentration or duration of exposure is critical. BxPC-3 cells are unlikely to harbor E/M or M-type cells as they are VIM negative, while MIA PaCa-2 cells are unlikely to contain E or E/M-type cells as they are ECAD negative.

Similar articles

Cited by

References

    1. Brabletz S., Schuhwerk H., Brabletz T., Stemmler M.P. Dynamic EMT: A multi-tool for tumor progression. EMBO J. 2021;40:e108647. doi: 10.15252/embj.2021108647. - DOI - PMC - PubMed
    1. Marusyk A., Almendro V., Polyak K. Intra-tumour heterogeneity: A looking glass for cancer? Nat. Rev. Cancer. 2012;12:323–334. doi: 10.1038/nrc3261. - DOI - PubMed
    1. Hass R., von der Ohe J., Ungefroren H. The Intimate Relationship Among EMT, MET and TME: A T(ransdifferentiation) E(nhancing) M(ix) to Be Exploited for Therapeutic Purposes. Cancers. 2020;12:3674. doi: 10.3390/cancers12123674. - DOI - PMC - PubMed
    1. Rhim A.D., Mirek E.T., Aiello N.M., Maitra A., Bailey J.M., McAllister F., Reichert M., Beatty G.L., Rustgi A.K., Vonderheide R.H., et al. EMT and dissemination precede pancreatic tumor formation. Cell. 2012;148:349–361. doi: 10.1016/j.cell.2011.11.025. - DOI - PMC - PubMed
    1. Katsuno Y., Meyer D.S., Zhang Z., Shokat K.M., Akhurst R.J., Miyazono K., Dernyck R. Chronic TGF-β exposure drives stabilized EMT, tumor stemness, and cancer drug resistance with vulnerability to bitopic mTOR inhibition. Sci. Signal. 2019;12:eaau8544. doi: 10.1126/scisignal.aau8544. - DOI - PMC - PubMed