. 2022 Apr 20;14(9):2065.
doi: 10.3390/cancers14092065.

Genomic Profile in a Non-Seminoma Testicular Germ-Cell Tumor Cohort Reveals a Potential Biomarker of Sensitivity to Platinum-Based Therapy

Affiliations

Genomic Profile in a Non-Seminoma Testicular Germ-Cell Tumor Cohort Reveals a Potential Biomarker of Sensitivity to Platinum-Based Therapy

Rodrigo González-Barrios et al. Cancers (Basel). .

Abstract

Despite having a favorable response to platinum-based chemotherapies, ~15% of Testicular Germ-Cell Tumor (TGCT) patients are platinum-resistant. Mortality rates among Latin American countries have remained constant over time, which makes the study of this population of particular interest. To gain insight into this phenomenon, we conducted whole-exome sequencing, microarray-based comparative genomic hybridization, and copy number analysis of 32 tumors from a Mexican cohort, of which 18 were platinum-sensitive and 14 were platinum-resistant. We incorporated analyses of mutational burden, driver mutations, and SNV and CNV signatures. DNA breakpoints in genes were also investigated and might represent an interesting research opportunity. We observed that sensitivity to chemotherapy does not seem to be explained by any of the mutations detected. Instead, we uncovered CNVs, particularly amplifications on segment 2q11.1 as a novel variant with chemosensitivity biomarker potential. Our data shed light into understanding platinum resistance in a Latin-origin population.

Keywords: CGH; CNVs and DNA breakpoints; SNVs; TGCT; WES; platinum-resistance.


Conflict of interest statement

The authors declare no conflict of interest.

Figures

Figure 1
Figure 1
Comparison of tumor mutation burden in INCan-TCGT cohort vs. TCGA. (A) Median frequencies of somatic variants reported in exome sequencing (horizontal lines) across multiple tumor types reported in TCGA. Left to right, highest, and lower frequencies, as measured in mutations per megabase (Mb). Broadly, the INCan-TCGT cohort (orange and blue dots) has shown (both platinum sensitive and resistant samples) that the mutation rate is higher than reported in TCGA for TGCT tumors. (B) Discrimination of mutation burden by response. Platinum-resistant samples (orange dots) have shown higher (yet not significant) frequency in variants per sample in comparison with platinum-sensitive TGCT samples.
Figure 2
Figure 2
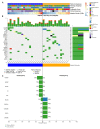
Mutational landscape of cancer driver genes in TGCT. (A) Heatmap with clinical features of patients, each row represents a sample divided by response group and another clinical characteristic. (B) Oncoplot showing the most frequently mutated coding genes across 32 NS-TGCTs by response groups. Each column represents a sample and each row a different gene with associated color for each mutation type. The top bar plot has the frequency and type of mutations for each patient, while the right barplot has the frequency of mutations in each gene. Samples are ordered by the platinum response group, resistant and sensitive (orange and blue, respectively). The highest frequency of mutations in each gene is 9% and represents all random mutations observed in at least two samples. (C) Most frequently mutated genes and percentage of cases where these mutations were found separated among groups, sensitive (left) and resistant (right). Neither gene significantly differentiates the groups.
Figure 3
Figure 3
Oncopathways and genomic breakpoints analysis. (A,B) Frequency plot of oncopathways affected in platinum-sensitive and platinum-resistant samples, shown left to right, fraction of the pathway affected and the fraction of samples that present an event located in these pathways. There are not the same oncopathways affected between the two response groups. (C) Gene Breakpoint analysis, derived from CNVKIT: Top 20 most frequent genes of all the genes that had breakpoints in the whole cohort. (D) Oncoplot with most frequent breakpoints in genes that greatly separated the two conditions. The fold change is the log-ratio of the fraction of patients between resistant and sensitive that have those breakpoints. Log2 (fraction of breakpoints in resistant)/(fraction of breakpoints in sensitive).
Figure 4
Figure 4
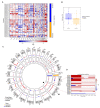
Significant CNVs segments that can distinguish between resistant and sensitive response to platinum. (A) Heatmap of calls in copy number variations (either bins or regions). It shows an overview of the larger-scale CNVs for all our samples (both platinum responses), bins of gain (red) and loss (blue) are in color range for all genome arrays showing low- and higher-amplitude segments. (B) Heatmap from CNVKIT focused on chr2, each row represents a patient sample, and each column represents an event (gain in red, loss in blue) that can occur in this position (Mb). Zoom shows a heatmap focused on events in the 2q11.1 region, gain events are mostly common in sensitive samples. (C) Circos plot of arm-level events obtained with GISTIC analysis, separating sensitive (inner circle, blue) from resistant (outer circle, orange). (D) Boxplot of log-ratio of amplifications over the losses, we see that the sensitive samples tend to have this ratio higher than the resistant ones (analysis exclude X, Y chromosomes, p-value from Wilcoxon test).
Figure 5
Figure 5
Most frequent arm-level amplifications/deletions events between sensitive and resistant TGCT. (A,B) Heatmap of arm-level regions top 20 in platinum resistant samples, each row represents a segment with its frequency, and each column a patient of the cohort that presents an event in these regions. Ordered by stage. Left to the right, resistant and sensitive. (C,D) Correlation (with significant p value) between frequency of arm level events (Y) and number of genes in chromosome arm (X) in platinum-resistant and platinum-sensitive, respectively. Anticorrelation (-r) is higher in sensitive samples, left to the right, resistant and sensitive.
Figure 6
Figure 6
CGH array reveals a genomic landscape of instability in TGCT patients. (A) aCGH of all samples, each sample with large events in the chromosome array was aligned in the same position. Deep color in a region represents a higher frequency of incidence (two or more samples) of events in the region (gain in blue, loss in red). (B,C) Resistant (up) and Sensitive (down) samples in chromosome 12, showing that sensitive and resistant ones had 12p amplification, except in a case of each group. (D,E) Resistant and Sensitive ones aligned separately to view the differences on frequency of gain and loss events, showing that resistant ones present more events of gain than sensitive samples.

Similar articles

Cited by

References

    1. Znaor A., Lortet-Tieulent J., Jemal A., Bray F. International Variations and Trends in Testicular Cancer Incidence and Mortality. Eur. Urol. 2014;65:1095–1106. doi: 10.1016/j.eururo.2013.11.004. - DOI - PubMed
    1. Ghazarian A.A., Kelly S.P., Altekruse S.F., Rosenberg P.S., McGlynn K.A. Future of testicular germ cell tumor incidence in the United States: Forecast through 2026. Cancer. 2017;123:2320–2328. doi: 10.1002/cncr.30597. - DOI - PMC - PubMed
    1. Gurney J.K., Florio A.A., Znaor A., Ferlay J., Laversanne M., Sarfati D., Bray F., McGlynn K.A. International Trends in the Incidence of Testicular Cancer: Lessons from 35 Years and 41 Countries. Eur. Urol. 2019;76:615–623. doi: 10.1016/j.eururo.2019.07.002. - DOI - PMC - PubMed
    1. Allen J.C., Kirschner A., Scarpato K.R., Morgans A.K. Current Management of Refractory Germ Cell Tumors and Future Directions. Curr. Oncol. Rep. 2017;19:8. doi: 10.1007/s11912-017-0572-y. - DOI - PubMed
    1. Jacobsen C., Honecker F. Cisplatin resistance in germ cell tumours: Models and mechanisms. Andrology. 2015;3:111–121. doi: 10.1111/andr.299. - DOI - PubMed

LinkOut - more resources