Circulating Cell-Free DNA Assessment in Biofluids from Children with Neuroblastoma Demonstrates Feasibility and Potential for Minimally Invasive Molecular Diagnostics
- PMID: 35565208
- PMCID: PMC9099910
- DOI: 10.3390/cancers14092080
Circulating Cell-Free DNA Assessment in Biofluids from Children with Neuroblastoma Demonstrates Feasibility and Potential for Minimally Invasive Molecular Diagnostics
Abstract
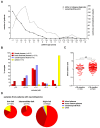
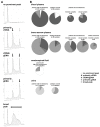
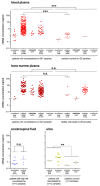
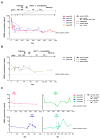
Liquid biopsy strategies in pediatric patients are challenging due to low body weight. This study investigated cfDNA size distribution and concentration in blood, bone marrow, cerebrospinal fluid, and urine from 84 patients with neuroblastoma classified as low (n = 28), intermediate (n = 6), or high risk (n = 50) to provide key data for liquid biopsy biobanking strategies. The average volume of blood and bone marrow plasma provided ranged between 1 and 2 mL. Analysis of 637 DNA electropherograms obtained by Agilent TapeStation measurement revealed five different major profiles and characteristic DNA size distribution patterns for each of the biofluids. The proportion of samples containing primarily cfDNA was, at 85.5%, the highest for blood plasma. The median cfDNA concentration amounted to 6.28 ng/mL (blood plasma), 58.2 ng/mL (bone marrow plasma), 0.08 ng/mL (cerebrospinal fluid), and 0.49 ng/mL (urine) in samples. Meta-analysis of the dataset demonstrated that multiple cfDNA-based assays employing the same biofluid sample optimally require sampling volumes of 1 mL for blood and bone marrow plasma, 2 mL for cerebrospinal fluid, and as large as possible for urine samples. A favorable response to treatment was associated with a rapid decrease in blood-based cfDNA concentration in patients with high-risk neuroblastoma. Blood-based cfDNA concentration was not sufficient as a single parameter to indicate high-risk disease recurrence. We provide proof of concept that monitoring neuroblastoma-specific markers in very small blood volumes from infants is feasible.
Keywords: ALK mutation; ALK-inhibitor; MYCN amplification; cancer; detection of therapeutic targets; liquid biopsy; minimal residual disease; precision medicine; real-time monitoring of therapeutic efficacy.
Conflict of interest statement
The authors declare no conflict of interest.
Figures


Similar articles
-
Targeted Analysis of Cell-free Circulating Tumor DNA is Suitable for Early Relapse and Actionable Target Detection in Patients with Neuroblastoma.Clin Cancer Res. 2022 May 2;28(9):1809-1820. doi: 10.1158/1078-0432.CCR-21-3716. Clin Cancer Res. 2022. PMID: 35247920
-
Increased plasma concentration of cell-free DNA precedes disease recurrence in children with high-risk neuroblastoma.BMC Cancer. 2020 Feb 6;20(1):102. doi: 10.1186/s12885-020-6562-8. BMC Cancer. 2020. PMID: 32028911 Free PMC article.
-
Multiplexed Quantification of Four Neuroblastoma DNA Targets in a Single Droplet Digital PCR Reaction.J Mol Diagn. 2020 Nov;22(11):1309-1323. doi: 10.1016/j.jmoldx.2020.07.006. Epub 2020 Aug 26. J Mol Diagn. 2020. PMID: 32858250
-
The pitfalls and promise of liquid biopsies for diagnosing and treating solid tumors in children: a review.Eur J Pediatr. 2020 Feb;179(2):191-202. doi: 10.1007/s00431-019-03545-y. Epub 2020 Jan 3. Eur J Pediatr. 2020. PMID: 31897843 Free PMC article. Review.
-
Liquid biopsy with cell free DNA: new horizons for prostate cancer.Crit Rev Clin Lab Sci. 2021 Jan;58(1):60-76. doi: 10.1080/10408363.2020.1803789. Epub 2020 Aug 17. Crit Rev Clin Lab Sci. 2021. PMID: 32805148 Review.
Cited by
-
Presence of On-Target Resistant Mutation in Pre-Treatment Samples of ALK Fusion Gene Positive Lung Cancer Patients.Cancers (Basel). 2025 Mar 25;17(7):1090. doi: 10.3390/cancers17071090. Cancers (Basel). 2025. PMID: 40227636 Free PMC article.
-
Cell-Free DNA: Features and Attributes Shaping the Next Frontier in Liquid Biopsy.Mol Diagn Ther. 2025 May;29(3):277-290. doi: 10.1007/s40291-025-00773-x. Epub 2025 Apr 16. Mol Diagn Ther. 2025. PMID: 40237938 Free PMC article. Review.
-
MYCN Impact on High-Risk Neuroblastoma: From Diagnosis and Prognosis to Targeted Treatment.Cancers (Basel). 2022 Sep 12;14(18):4421. doi: 10.3390/cancers14184421. Cancers (Basel). 2022. PMID: 36139583 Free PMC article. Review.
-
Circulating tumor cells in neuroblastoma: Current status and future perspectives.Cancer Med. 2023 Jan;12(1):7-19. doi: 10.1002/cam4.4893. Epub 2022 May 27. Cancer Med. 2023. PMID: 35632981 Free PMC article. Review.
-
The Neuroblastoma Microenvironment, Heterogeneity and Immunotherapeutic Approaches.Cancers (Basel). 2024 May 13;16(10):1863. doi: 10.3390/cancers16101863. Cancers (Basel). 2024. PMID: 38791942 Free PMC article. Review.
References
Grants and funding
LinkOut - more resources
Full Text Sources
Miscellaneous

