

A Novel Machine Learning 13-Gene Signature: Improving Risk Analysis and Survival Prediction for Clear Cell Renal Cell Carcinoma Patients
- PMID: 35565241
- PMCID: PMC9103317
- DOI: 10.3390/cancers14092111
A Novel Machine Learning 13-Gene Signature: Improving Risk Analysis and Survival Prediction for Clear Cell Renal Cell Carcinoma Patients
Abstract
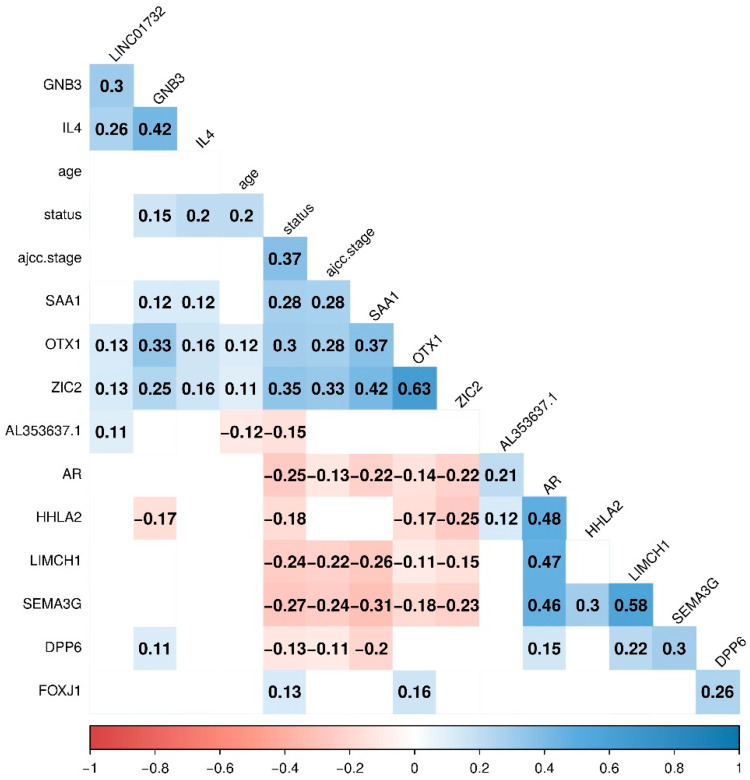
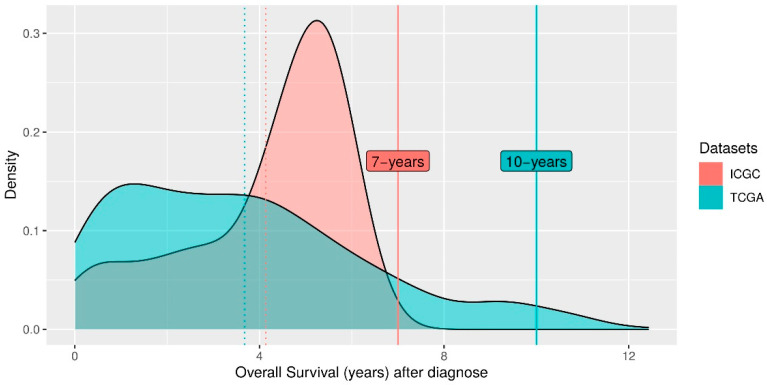
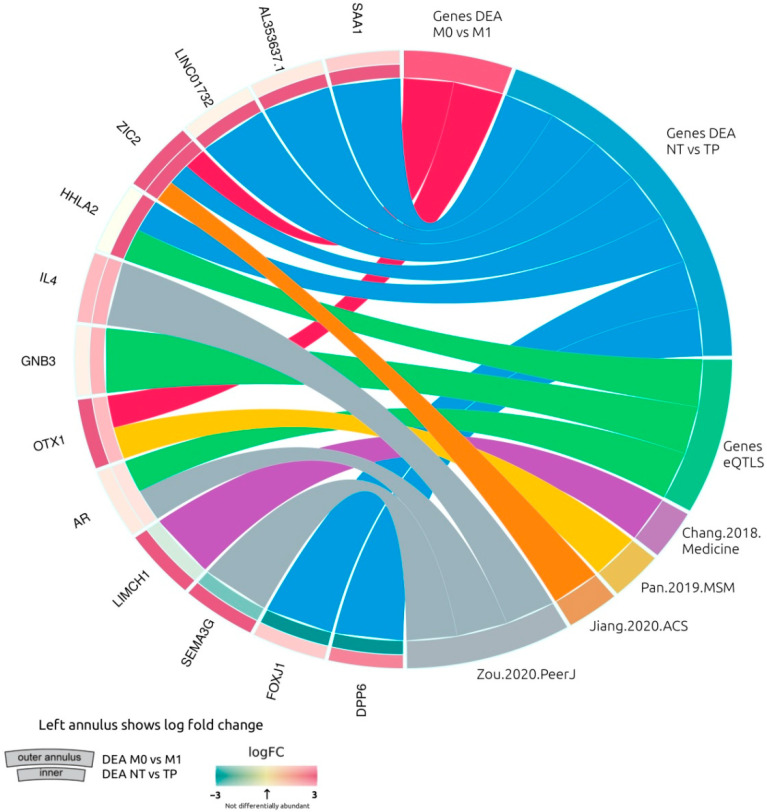
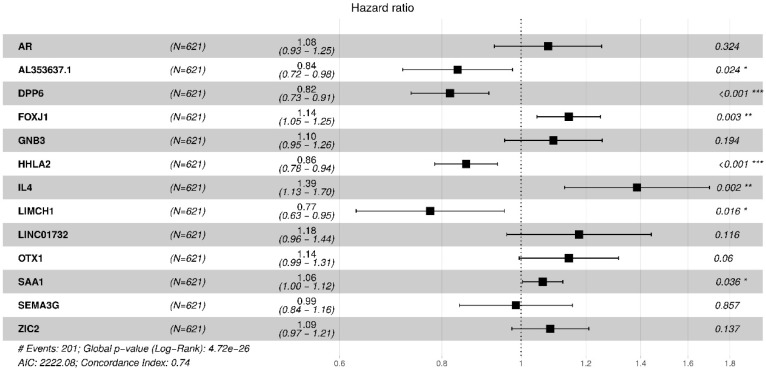
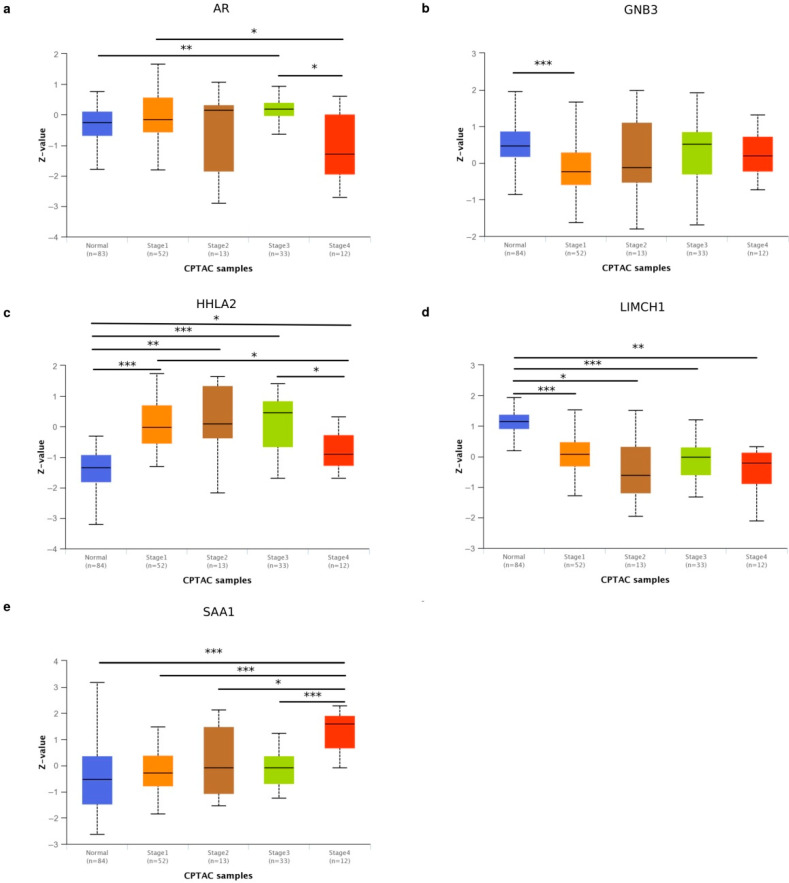
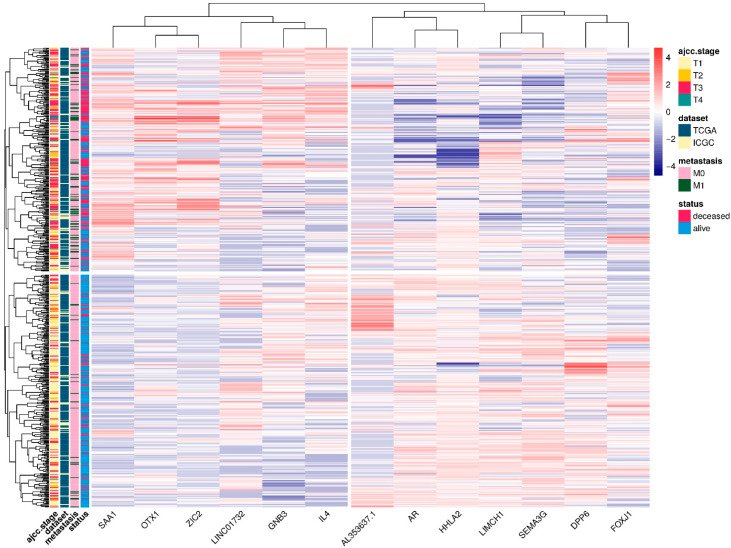
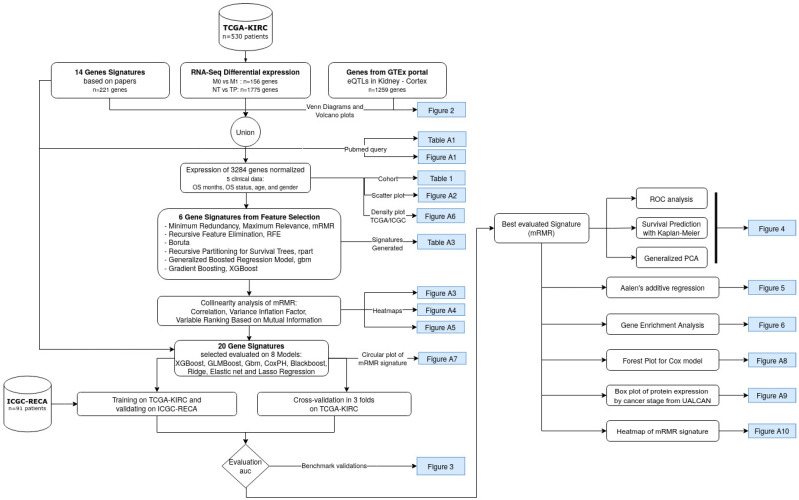
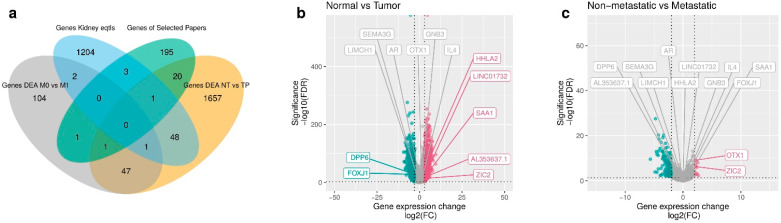
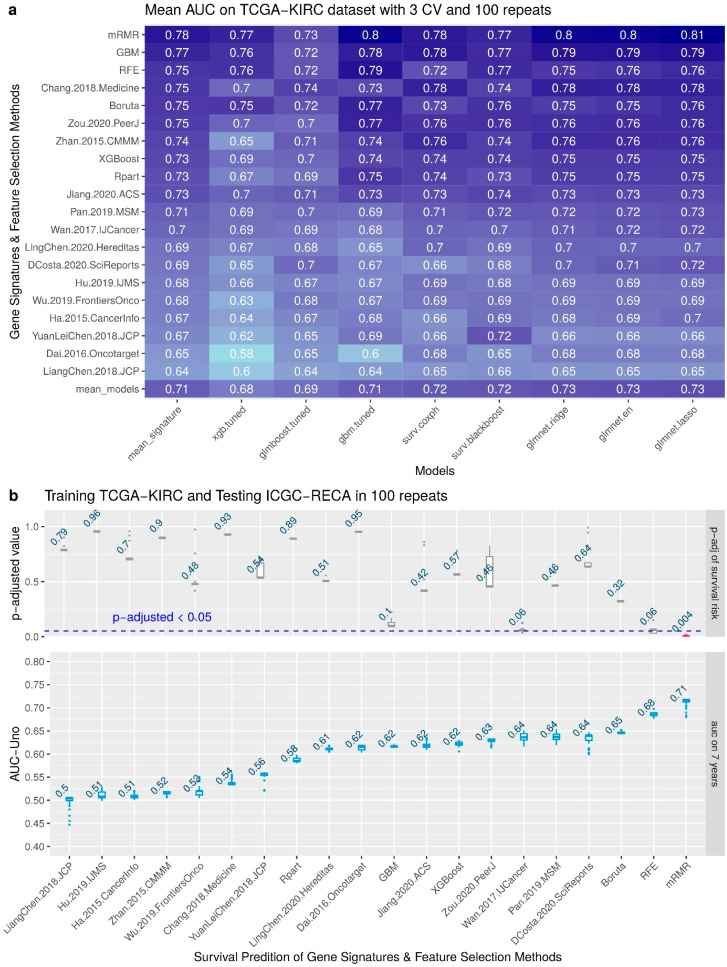
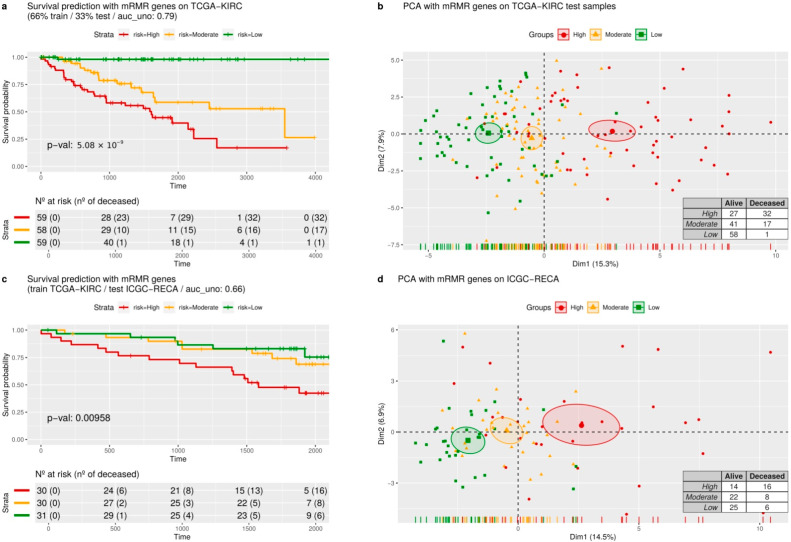
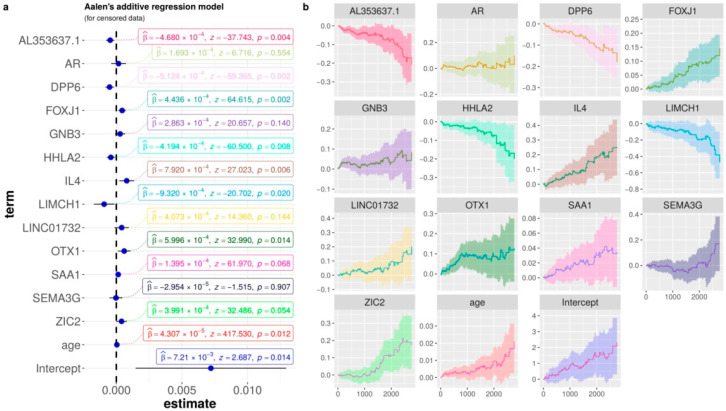
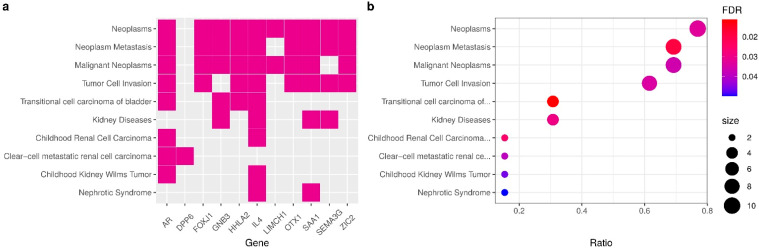
Patients with clear cell renal cell carcinoma (ccRCC) have poor survival outcomes, especially if it has metastasized. It is of paramount importance to identify biomarkers in genomic data that could help predict the aggressiveness of ccRCC and its resistance to drugs. Thus, we conducted a study with the aims of evaluating gene signatures and proposing a novel one with higher predictive power and generalization in comparison to the former signatures. Using ccRCC cohorts of the Cancer Genome Atlas (TCGA-KIRC) and International Cancer Genome Consortium (ICGC-RECA), we evaluated linear survival models of Cox regression with 14 signatures and six methods of feature selection, and performed functional analysis and differential gene expression approaches. In this study, we established a 13-gene signature (AR, AL353637.1, DPP6, FOXJ1, GNB3, HHLA2, IL4, LIMCH1, LINC01732, OTX1, SAA1, SEMA3G, ZIC2) whose expression levels are able to predict distinct outcomes of patients with ccRCC. Moreover, we performed a comparison between our signature and others from the literature. The best-performing gene signature was achieved using the ensemble method Min-Redundancy and Max-Relevance (mRMR). This signature comprises unique features in comparison to the others, such as generalization through different cohorts and being functionally enriched in significant pathways: Urothelial Carcinoma, Chronic Kidney disease, and Transitional cell carcinoma, Nephrolithiasis. From the 13 genes in our signature, eight are known to be correlated with ccRCC patient survival and four are immune-related. Our model showed a performance of 0.82 using the Receiver Operator Characteristic (ROC) Area Under Curve (AUC) metric and it generalized well between the cohorts. Our findings revealed two clusters of genes with high expression (SAA1, OTX1, ZIC2, LINC01732, GNB3 and IL4) and low expression (AL353637.1, AR, HHLA2, LIMCH1, SEMA3G, DPP6, and FOXJ1) which are both correlated with poor prognosis. This signature can potentially be used in clinical practice to support patient treatment care and follow-up.
Keywords: clear cell renal cell carcinoma (ccRCC); feature selection; gene signature; kidney cancer; machine learning; mutual information; prognosis; survival analysis.
Conflict of interest statement
The authors declare that they have no competing interests, and that the research was conducted in the absence of any commercial or financial relationships that could be construed as a potential conflict of interest. The funders had no role in study design, data collection and analysis, decision to publish, or preparation of the manuscript.
Figures
Similar articles
-
Mathematical and Machine Learning Models of Renal Cell Carcinoma: A Review.Bioengineering (Basel). 2023 Nov 16;10(11):1320. doi: 10.3390/bioengineering10111320. Bioengineering (Basel). 2023. PMID: 38002445 Free PMC article. Review.
-
Prediction of overall survival based upon a new ferroptosis-related gene signature in patients with clear cell renal cell carcinoma.World J Surg Oncol. 2022 Apr 14;20(1):120. doi: 10.1186/s12957-022-02555-9. World J Surg Oncol. 2022. PMID: 35422048 Free PMC article.
-
Identification and Validation of a Ferroptosis-Related Long Non-Coding RNA (FRlncRNA) Signature to Predict Survival Outcomes and the Immune Microenvironment in Patients With Clear Cell Renal Cell Carcinoma.Front Genet. 2022 Mar 8;13:787884. doi: 10.3389/fgene.2022.787884. eCollection 2022. Front Genet. 2022. PMID: 35350243 Free PMC article.
-
Novel amino acid metabolism-related gene signature to predict prognosis in clear cell renal cell carcinoma.Front Genet. 2022 Sep 2;13:982162. doi: 10.3389/fgene.2022.982162. eCollection 2022. Front Genet. 2022. PMID: 36118874 Free PMC article.
-
SurviveAI: Long Term Survival Prediction of Cancer Patients Based on Somatic RNA-Seq Expression.Cancer Inform. 2022 Oct 7;21:11769351221127875. doi: 10.1177/11769351221127875. eCollection 2022. Cancer Inform. 2022. PMID: 36225330 Free PMC article. Review.
Cited by
-
Kidney cancer diagnosis and surgery selection by double decker convolutional neural network from CT scans combined with great wall construction algorithm.Abdom Radiol (NY). 2025 Apr 5. doi: 10.1007/s00261-025-04900-4. Online ahead of print. Abdom Radiol (NY). 2025. PMID: 40186648
-
A predictive signature based on enhancer RNA associates with immune infiltration and aids treatment decision in clear cell renal cell carcinoma.Front Oncol. 2022 Oct 12;12:964838. doi: 10.3389/fonc.2022.964838. eCollection 2022. Front Oncol. 2022. PMID: 36313627 Free PMC article.
-
Mathematical and Machine Learning Models of Renal Cell Carcinoma: A Review.Bioengineering (Basel). 2023 Nov 16;10(11):1320. doi: 10.3390/bioengineering10111320. Bioengineering (Basel). 2023. PMID: 38002445 Free PMC article. Review.
-
The Importance of HHLA2 in Solid Tumors-A Review of the Literature.Cells. 2024 May 7;13(10):794. doi: 10.3390/cells13100794. Cells. 2024. PMID: 38786018 Free PMC article. Review.
-
A Novel KIF4A-related Model for Predicting Immunotherapy Response and Prognosis in Kidney Renal Clear Cell Carcinoma.Comb Chem High Throughput Screen. 2025;28(4):691-710. doi: 10.2174/0113862073296897240212114403. Comb Chem High Throughput Screen. 2025. PMID: 38357945
References
-
- Society A.C. Facts & Figures: 2020 Edition. 2020. [(accessed on 1 March 2022)]. Available online: https://www.cancer.org/research/cancer-facts-statistics/all-cancer-facts....
Grants and funding
LinkOut - more resources
Full Text Sources
Research Materials
Miscellaneous
