. 2022 Apr 24;14(9):2121.
doi: 10.3390/cancers14092121.

IGF2BP1 Promotes Proliferation of Neuroendocrine Neoplasms by Post-Transcriptional Enhancement of EZH2

Affiliations

IGF2BP1 Promotes Proliferation of Neuroendocrine Neoplasms by Post-Transcriptional Enhancement of EZH2

Florian Sperling et al. Cancers (Basel). .

Abstract

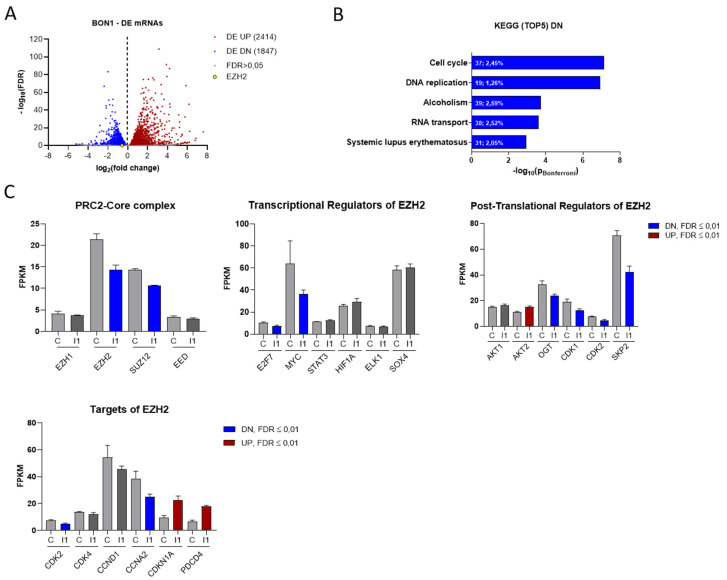
Neuroendocrine neoplasms (NENs) represent a heterogenous class of highly vascularized neoplasms that are increasing in prevalence and are predominantly diagnosed at a metastatic state. The molecular mechanisms leading to tumor initiation, metastasis, and chemoresistance are still under investigation. Hence, identification of novel therapeutic targets is of great interest. Here, we demonstrate that the RNA-binding Protein IGF2BP1 is a post-transcriptional regulator of components of the Polycomb repressive complex 2 (PRC2), an epigenic modifier affecting transcriptional regulation and proliferation: Comprehensive in silico analyses along with in vitro experiments showed that IGF2BP1 promotes neuroendocrine tumor cell proliferation by stabilizing the mRNA of Enhancer of Zeste 2 (EZH2), the catalytic subunit of PRC2, which represses gene expression by tri-methylation of histone H3 at lysine 27 (H3K27me3). The IGF2BP1-driven stabilization and protection of EZH2 mRNA is m6A-dependent and enhances EZH2 protein levels which stimulates cell cycle progression by silencing cell cycle arrest genes through enhanced H3K27 tri-methylation. Therapeutic inhibition of IGF2BP1 destabilizes EZH2 mRNA and results in a reduced cell proliferation, paralleled by an increase in G1 and sub-G1 phases. Combined targeting of IGF2BP1, EZH2, and Myc, a transcriptional activator of EZH2 and well-known target of IGF2BP1 cooperatively induces tumor cell apoptosis. Our data identify IGF2BP1 as an important driver of tumor progression in NEN, and indicate that disruption of the IGF2BP1-Myc-EZH2 axis represents a promising approach for targeted therapy of neuroendocrine neoplasms.

Keywords: EZH2; H3K27me3; IGF2BP1; NEN; RNA-binding protein; cell cycle.


Conflict of interest statement

The authors declare no conflict of interest.

Figures

Figure 1
Figure 1
IGF2BP1 is highly expressed in pNEN and is associated with worse prognosis. (A) IGF2BP1 mRNA expression in PDAC tumors matched with TCGA normal and GTEx data (left panel) and median overall survival in PDAC with low (blue line) or high (red line) IGF2BP1 expression (right panel). Blot generated using GEPIA2 database. (B) IGF2BP1 mRNA expression in primary pancreatic neuroendocrine tumors (pNEN) compared to corresponding lymph node and liver metastasis (left panel; data derived from Scott et al., 2020), as well as 5-year survival rate of pNEN patients (right panel) depending on cancer stage: Localized (tumor diagnosed at a localized stage), regional (tumor spreading to surrounding tissues and/or regional lymph nodes), distant (tumor with distant metastases). Data from Cancer.Net. (C,D) Western blots of IGF2BP1 protein levels in pooled benign murine pancreatic Islet (BL6) and individually isolated insulinomas of RIP1-Tag2 mice (C), as well as whole cell lysates from BON1, Colo320 and NCIH727 NEN cell lines (D). Actin served as loading control. The uncropped western blot figures were presented in Figure S7.
Figure 2
Figure 2
Knock-down of IGF2BP1 results in reduced proliferation and cell cycle progression in NEN cell lines. (A) Western blots of IGF2BP1 knockdown (siI1) in indicated NEN cell lines after 72 h. Actin served as loading control. (B) Cell proliferation as determined by cell counting at indicated time points upon knock-down of IGF2BP1 compared to control (siC) transfected cells. (C) Cell viability as determined by ATP-based CellTiter Glo assay after 72 h of IGF2BP1 knock-down in indicated NEN cell lines. Cell viability was normalized to siC transfected cells serving as control. (D) Cell cycle analysis of NEN cells 72 h after knockdown of IGF2BP1 showing the percentage of cells in the indicated cell cycle phases. (E) Apoptosis analyzed by Annexin V staining 72 h after IGF2BP1 knock-down. Annexin V and propidium iodide negative cells were summarized as living fraction and compared to positively stained apoptotic cells. Statistical significance was determined by Student’s t-test: * p < 0.05; ** p < 0.01. The uncropped western blot figures were presented in Figure S7.
Figure 3
Figure 3
IGF2BP1 knockdown affects the transcriptional landscape of NEN cells. (A) Volcano plots of differentially expressed (DE) genes (threshold: FDR < 0.05) determined by RNA-seq in BON1 cells upon IGF2BP1 knockdown compared to siC transfected cells after 72 h. (B) KEGG- pathway analysis of mRNAs downregulated upon IGF2BP1 knockdown in BON1 cells (threshold: FDR < 0.01). Pathways are ranked by Bonferroni-corrected significance. First number indicates counts mapped to the respective pathway and second number gives percentage of these counts related to total pathway counts. (C) Expression of potential PRC2 components as well as EZH2 transcriptional, post-translational regulators and targets in BON1 cells after IGF2BP1 (I1) knockdown compared to siC (C) evaluated by RNA-seq.
Figure 4
Figure 4
IGF2BP1 regulates EZH2 mRNA stability. (A) Representative Western blots of indicated proteins upon knock-down of IGF2BP1 (siI1) in NEN cells. Actin served as loading control. (B) RNA-Immunoprecipitation (RIP) analysis by qRT-PCR after pulldown of IGF2BP1 protein. Binding of MYC and EZH2 mRNA to IGF2BP1 was compared to IgG isotype control. TERT mRNA served as negative control and showed no accumulation. All amplifications were normalized to total RNA input. (C) Decay of EZH2 mRNA upon IGF2BP1 knock-down was analyzed via Actinomycin D treatment at indicated time points. (D) Expression of EZH2 mRNA (left panel) and protein (right panel) was analyzed upon knock-down of m6A-writers METTL3/14 after 72 h. mRNA levels were determined by qRT-PCR, normalized to ribosomal protein RPLP0 as internal standard and shown as fold change to siC. Protein expression is shown in representative Western blots. Actin served as loading. Data are representative for n = 3 independent experiments. Statistical significance was determined by Student’s t-test: * p < 0.05; ** p < 0.01. The uncropped western blot figures were presented in Figure S7.
Figure 5
Figure 5
The IGF2BP1-MYC-EZH2 network is a target for pharmacological inhibition. (A) Representative Western blot of EZH2, IGF2BP1, and MYC knock-down in transfected BON1 cells. Actin served as loading control. (B) Proliferation of BON1 cells upon transfection with indicated siRNAs after 72 h. (C) Schematic strategy of IGF2BP1-MYC-EZH2 inhibition with commercially available inhibitors. DZNep targeting methylation activity of EZH2/PRC2 complex, BTYNB inhibiting IGF2BP1 binding to MYC mRNA and OTX015 inhibiting BRD2/3/4 transcription factors leading to reduced MYC expression. (D) Cell viability determined by Cell Titer Glo in BON1 and NCIH727 cells treated with indicated inhibitor concentrations for 72 h. Viability of DMSO treated cells served as control and was set to one. (E) Analysis of cell proliferation by cell counting at indicated time points upon treatment with indicated inhibitor concentrations. (F) Cell cycle analysis of NEN cells treated with indicated inhibitor concentrations for 72 h. Percentage of cells in indicated cell cycle phases were determined by propidium iodide staining. (G) Representative Western blot analysis of respective target proteins after treatment with indicated inhibitors for 72 h. Untreated (mock) and DMSO treated cells were used as expression controls. Actin served as loading control. Statistical significance was determined by Student’s t-test: * p < 0.05; ** p < 0.01; *** p < 0.001. The uncropped western blot figures were presented in Figure S7.

Similar articles

Cited by

References

    1. Dasari A., Shen C., Halperin D., Zhao B., Zhou S., Xu Y., Shih T., Yao J.C. Trends in the Incidence, Prevalence, and Survival Outcomes in Patients With Neuroendocrine Tumors in the United States. JAMA Oncol. 2017;3:1335–1342. doi: 10.1001/jamaoncol.2017.0589. - DOI - PMC - PubMed
    1. Oronsky B., Ma P.C., Morgensztern D., Carter C.A. Nothing But NET: A Review of Neuroendocrine Tumors and Carcinomas. Neoplasia. 2017;19:991–1002. doi: 10.1016/j.neo.2017.09.002. - DOI - PMC - PubMed
    1. Bosman F.T., Carneiro F., Hruban R.H., Theise N.D. WHO Classification of Tumours of the Digestive System. 4th ed. Volume 3. International Agency for Research on Cancer; Lyon, France: 2010. pp. 1–417.
    1. Asamura H., Kameya T., Matsuno Y., Noguchi M., Tada H., Ishikawa Y., Yokose T., Jiang S.X., Inoue T., Nakagawa K., et al. Neuroendocrine neoplasms of the lung: A prognostic spectrum. J. Clin. Oncol. 2006;24:70–76. doi: 10.1200/JCO.2005.04.1202. - DOI - PubMed
    1. Lewis M.A., Hobday T.J. Treatment of neuroendocrine tumor liver metastases. Int. J. Hepatol. 2012;2012:973946. doi: 10.1155/2012/973946. - DOI - PMC - PubMed

LinkOut - more resources