. 2022 Apr 26;14(9):2148.
doi: 10.3390/cancers14092148.

Spatial Characterization of Tumor-Infiltrating Lymphocytes and Breast Cancer Progression

Affiliations

Spatial Characterization of Tumor-Infiltrating Lymphocytes and Breast Cancer Progression

Danielle J Fassler et al. Cancers (Basel). .

Abstract

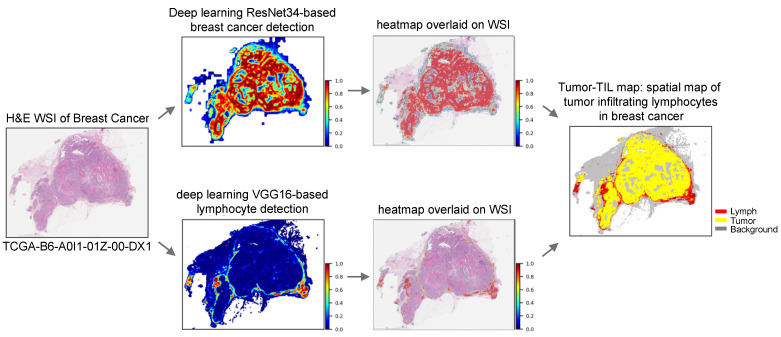
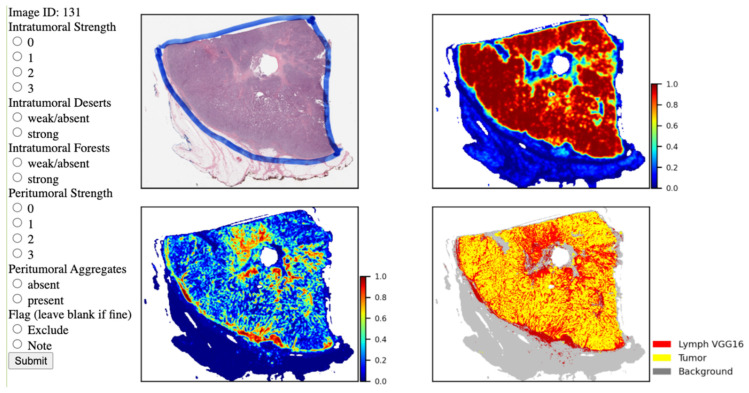
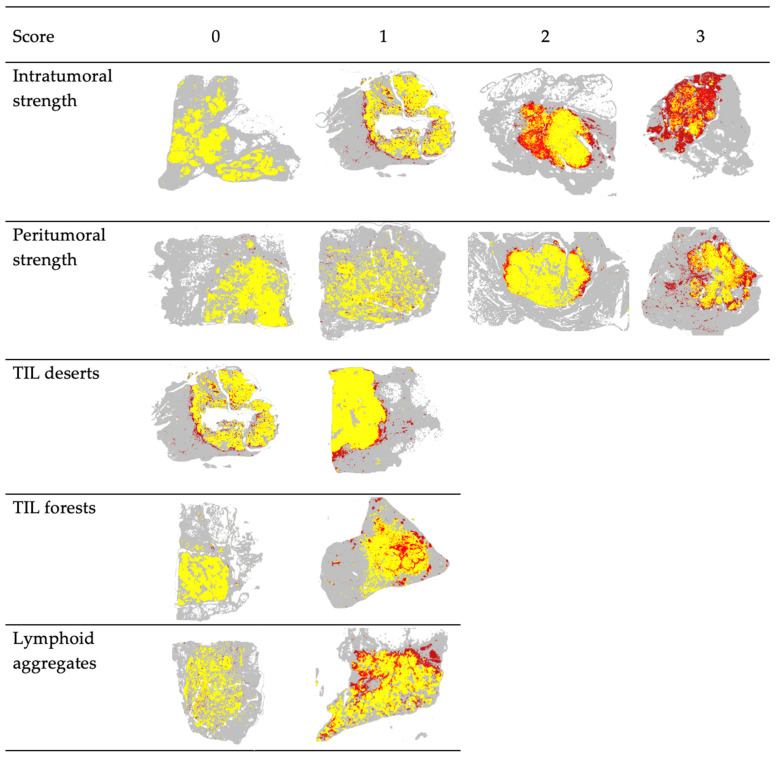
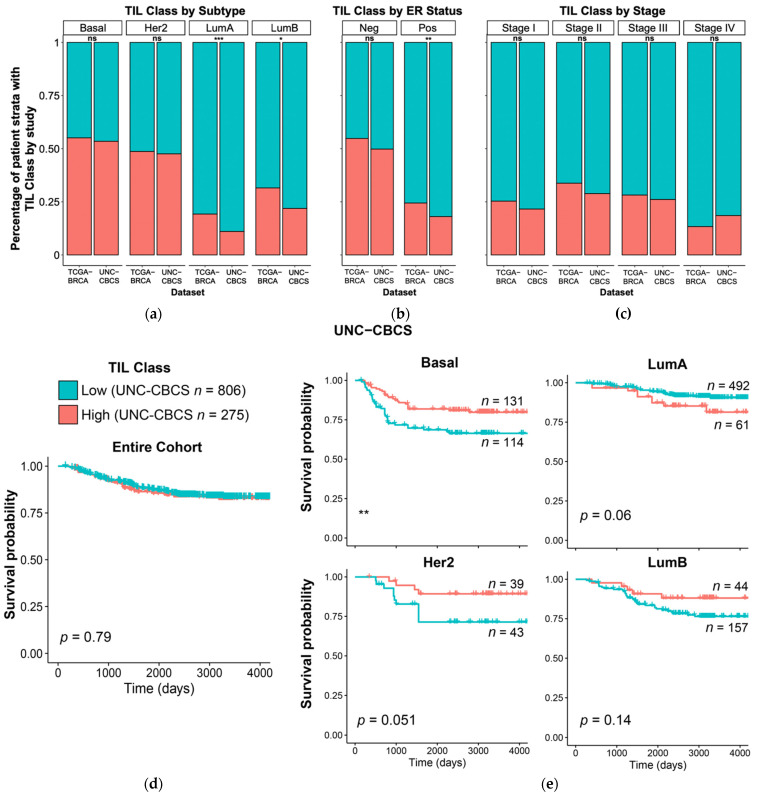
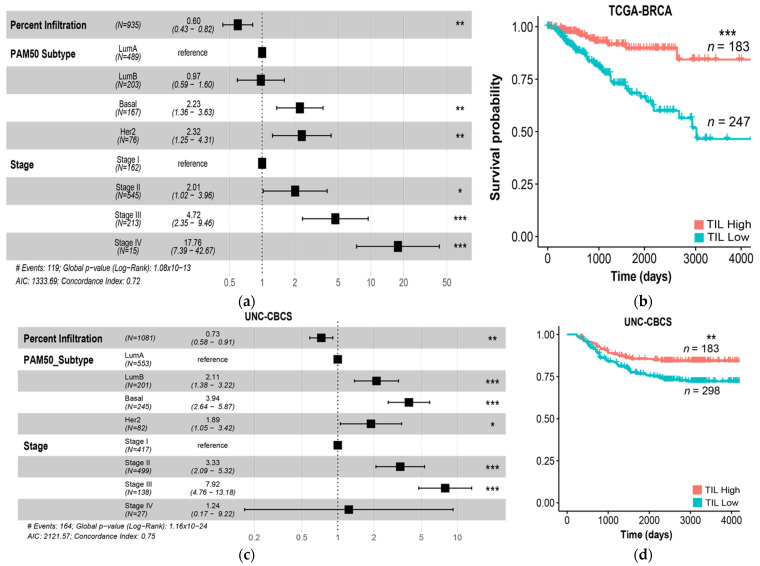
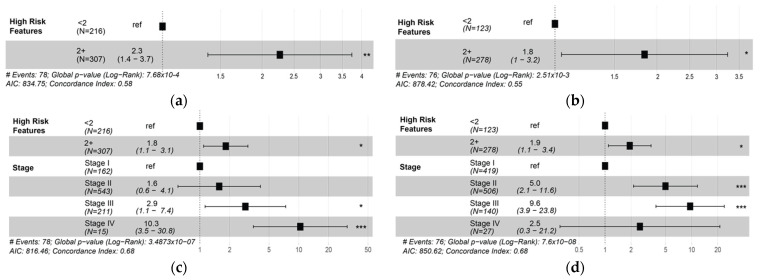
Tumor-infiltrating lymphocytes (TILs) have been established as a robust prognostic biomarker in breast cancer, with emerging utility in predicting treatment response in the adjuvant and neoadjuvant settings. In this study, the role of TILs in predicting overall survival and progression-free interval was evaluated in two independent cohorts of breast cancer from the Cancer Genome Atlas (TCGA BRCA) and the Carolina Breast Cancer Study (UNC CBCS). We utilized machine learning and computer vision algorithms to characterize TIL infiltrates in digital whole-slide images (WSIs) of breast cancer stained with hematoxylin and eosin (H&E). Multiple parameters were used to characterize the global abundance and spatial features of TIL infiltrates. Univariate and multivariate analyses show that large aggregates of peritumoral and intratumoral TILs (forests) were associated with longer survival, whereas the absence of intratumoral TILs (deserts) is associated with increased risk of recurrence. Patients with two or more high-risk spatial features were associated with significantly shorter progression-free interval (PFI). This study demonstrates the practical utility of Pathomics in evaluating the clinical significance of the abundance and spatial patterns of distribution of TIL infiltrates as important biomarkers in breast cancer.

Keywords: TILs; breast cancer; computational pathology; machine learning; risk of recurrence.


Conflict of interest statement

The University of North Carolina, Chapel Hill has a license of intellectual property interest in GeneCentric Diagnostics and BioClassifier, LLC, which may be used in this study. The University of North Carolina, Chapel Hill may benefit from this interest that is/are related to this research. The terms of this arrangement have been reviewed and approved by the University of North Carolina, Chapel Hill Conflict of Interest Program in accordance with its conflict-of-interest policies.

Figures

Figure 1
Figure 1
Machine learning and computer vision in computational pathology to spatially map tumor-infiltrating lymphocytes (TILs) in breast cancer. Top panels show tumor detection presented as a spatial probability heatmap to evaluate algorithmic performance (non-tumor tissue colored blue), which is then overlaid on the original H&E WSI. Bottom panels show automated lymphocyte detection presented as a spatial probability heatmap (non-lymphocyte tissue colored blue) and then overlaid on the original H&E WSI. Combining the outputs of tumor and lymphocyte detection generates Tumor-TIL maps to evaluate the abundance and spatial distribution of peritumoral and intratumoral TILs (tumor colored yellow, lymphocytes colored red, and background non-tumor/non-lymphocyte tissue colored gray). This Tumor-TIL map shows the presence of peritumoral TILs with a paucity of intratumoral TIL infiltrates. Image: BRCA TCGA-B6-A0I1-01Z-00-DX1, high-grade breast cancer; cancer detection with ResNet model; lymphocyte detection with VGG16 model.
Figure 2
Figure 2
Scoring interface to characterize spatial features of TIL infiltrates in breast cancer. Composite Tumor-TIL maps of H&E WSIs of breast cancer provide the ability to estimate the abundance and spatial distribution of TILs in a straightforward manner. Tumor-TIL maps are depicted as 4-panel composites containing low-resolution H&E WSI (upper left), tumor probability heatmap (upper right), lymphocyte probability heatmap (lower left), and the Tumor-TIL map (bottom right). Tumor and lymphocyte probability maps use a color scale to indicate probability from 0 (blue) to 1 (red). In the Tumor-TIL map, yellow represents tumor, red depicts lymphocytes, and non-tumor/non-lymphocyte patches are represented as gray background tissue. Observers use this interface to characterize the magnitude of intratumoral and peritumoral TIL infiltrates on a scale of 0 (none/absent) to 3 (marked). The presence of large intratumoral aggregates (forests), immune cold areas devoid of TILs (deserts), and tertiary lymphoid aggregates are indicated on the left panel. In this example, case 131, intratumoral strength was graded as 3 with weak/absent deserts and strong forests, peritumoral strength was graded as 3, and tertiary peritumoral aggregates as absent. Poor quality images and cases where the algorithms did not properly generate a Tumor-TIL map were flagged and excluded.
Figure 3
Figure 3
Representative Tumor-TIL maps from TCGA BRCA demonstrating the scoring paradigm for spatial features of TIL infiltrates. Scores of 0, 1, 2, and 3 correspond to terminology used by pathologists for grading, such as minimal, mild, moderate, and severe and/or 1+, 2+, and 3+. Detailed descriptions for scores (columns) for each category (rows) are found in Table 2. Red depicts lymphocytes, yellow depicts tumor regions, and gray represents non-tumor and non-lymphocyte background tissue regions.
Figure 4
Figure 4
Comparison of computed intratumoral TIL infiltrate percentage in TCGA BRCA and UNC CBCS and relationship to progression-free interval (PFI). The median TIL infiltrate percentage was computed for each study to distinguish cases as high or low TIL class; percent infiltration was determined using VGG TIL detection algorithm. (ac) Percentage of patient strata classified as high and low TILs is shown for the TCGA BRCA and UNC CBCS studies grouped by (a) PAM50 molecular subtype, (b) estrogen receptor (ER) status, and (c) tumor stage. Blue denotes TIL class Low and Red denotes TIL class High. (d,e) Kaplan–Meier plots to show disease progression in the UNC CBCS cohort after dividing patients into high and low TIL classes around the mean TIL infiltrate percentage for the (d) entire UNC CBCS cohort and (e) cases split by PAM50 molecular subtype. Log-rank test was used to assess survival differences. *** = p < 0.001, ** = p < 0.05, * = p < 0.01.
Figure 5
Figure 5
TIL infiltration remains strongly predictive of survival across TCGA BRCA and UNC CBCS. (a) Forest plots of hazard ratios (estimates and 95% CIs) from a multivariate Cox proportional hazards model of progression-free interval (PFI) incorporating PAM50 subtype and tumor stage. Vertical dotted line indicates a hazard ratio of 1. TIL infiltrate percentage ranges from 0% to 64.2% with SD of 10.4%. TIL infiltrate percentage is scaled by SD for all Cox Regression Analyses. (b) Kaplan–Meier survival analyses of TCGA BRCA patients after splitting into high and low TIL classes around the mean percent infiltration. (c) Forest plot of hazard ratios from a multivariate Cox proportional hazards model of PFI in the UNC CBCS including PAM50 subtype and tumor stage. TIL infiltration was calculated as a continuous variable with a range of 0% to 88.9% and scaled by SD (0.1), AIC: 2121.57. The dotted line indicates a hazard ratio of 1. The Concordance Index shows how much variance of risk is explained by the model, where 1 encapsulates all risk whereas 0.5 is random. (d) Kaplan–Meier survival analyses after dividing UNC CBCS patients into high and low TIL infiltration groups around the mean TIL infiltrate percentage. *** = p < 0.001, ** = p < 0.05, * = p < 0.01.
Figure 6
Figure 6
The presence of two or more ‘high-risk’ spatial features provides independent prognostic information. High-risk feature scores include low intratumoral TILs (scores of 0 or 1), absence of TIL forests (0), presence of immune cold TIL deserts (1), and low peritumoral TIL scores (0 or 1). (a,b) Forest plots of hazard ratios (estimates and 95% CIs) from a univariate Cox proportional hazards model of progression-free interval (PFI) comparing cases with two or more high-risk features (2+) to those with ≤1, as shown in (a) TCGA and (b) UNC CBCS. (c,d) Forest plots of hazard ratios (estimates and 95% CIs) from a multivariate Cox proportional hazards model of progression-free interval (PFI). The dotted line indicates a hazard ratio of 1, where (c) TCGA and (d) UNC CBCS. *** = p < 0.001, ** = p < 0.05, * = p < 0.01.

Similar articles

Cited by

References

    1. Virchow R. Die krankhaften Geschwülste; Dreissig Vorlesungen: Gehalten Während des Wintersemesters. Volume 2. Universität zu Berlin; Berlin, Germany: 1862. p. 1865.
    1. Ehrlich P. Experimentelle Studien an Mausetumoren. Z Krebsforsch. 1907;5:59–81. doi: 10.1007/BF02015526. - DOI
    1. Coley W.B. The treatment of malignant tumors by repeated inoculations of erysipelas: With a report of ten original cases. Am. J. Med. Sci. 1893;105:487. doi: 10.1097/00000441-189305000-00001. - DOI - PubMed
    1. Coley W.B. The classic: The treatment of malignant tumors by repeated inoculations of erysipelas: With a report of ten original cases. Clin. Orthop. Relat. Res. 1991;262:3–11. doi: 10.1097/00003086-199101000-00002. - DOI - PubMed
    1. Mihm M.C., Jr., Mulé J.J. Reflections on the Histopathology of Tumor-Infiltrating Lymphocytes in Melanoma and the Host Immune Response. Cancer Immunol. Res. 2015;3:827–835. doi: 10.1158/2326-6066.CIR-15-0143. - DOI - PMC - PubMed

LinkOut - more resources