

7T HR FID-MRSI Compared to Amino Acid PET: Glutamine and Glycine as Promising Biomarkers in Brain Tumors
- PMID: 35565293
- PMCID: PMC9101868
- DOI: 10.3390/cancers14092163
7T HR FID-MRSI Compared to Amino Acid PET: Glutamine and Glycine as Promising Biomarkers in Brain Tumors
Abstract
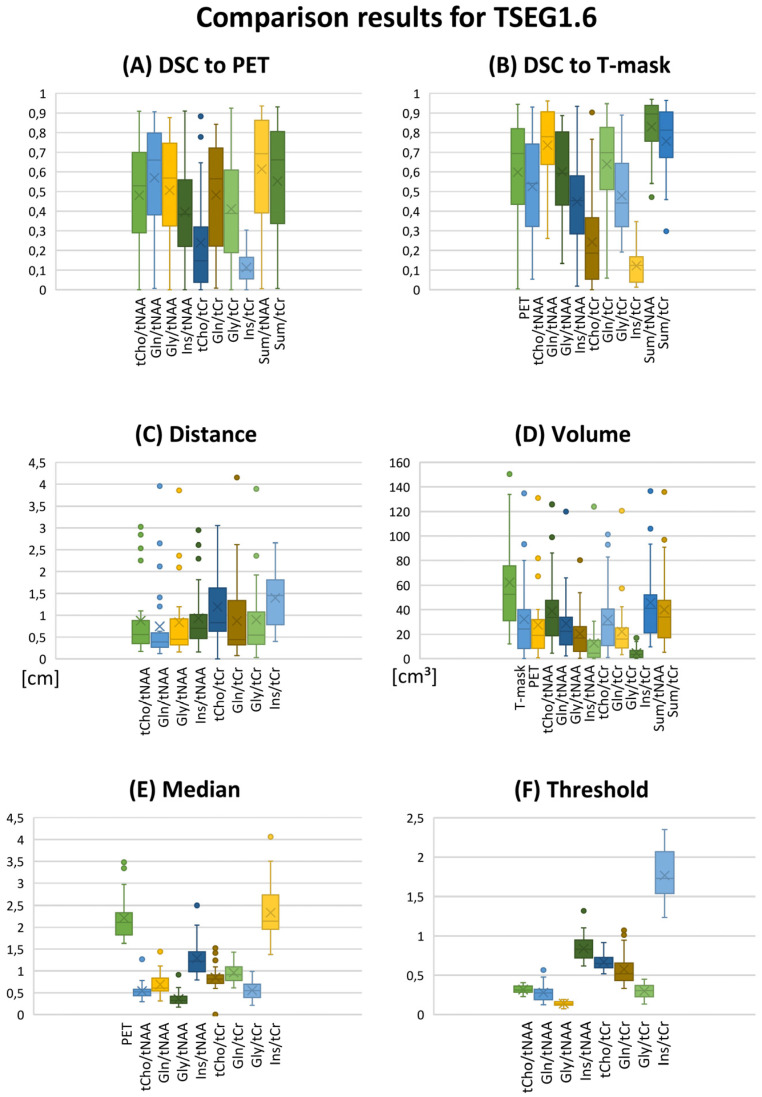
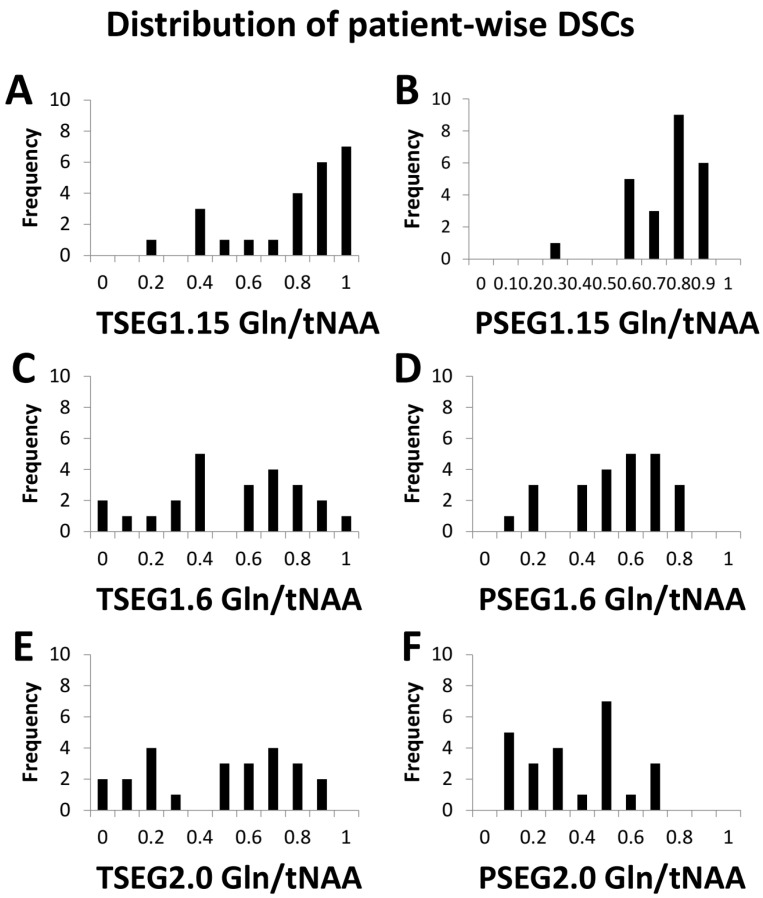
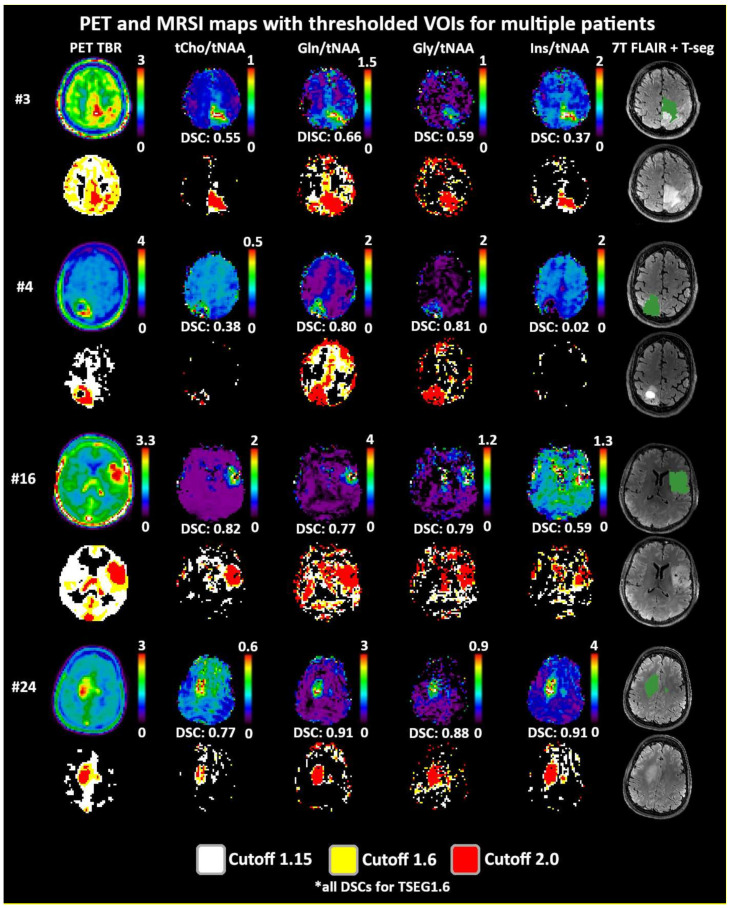
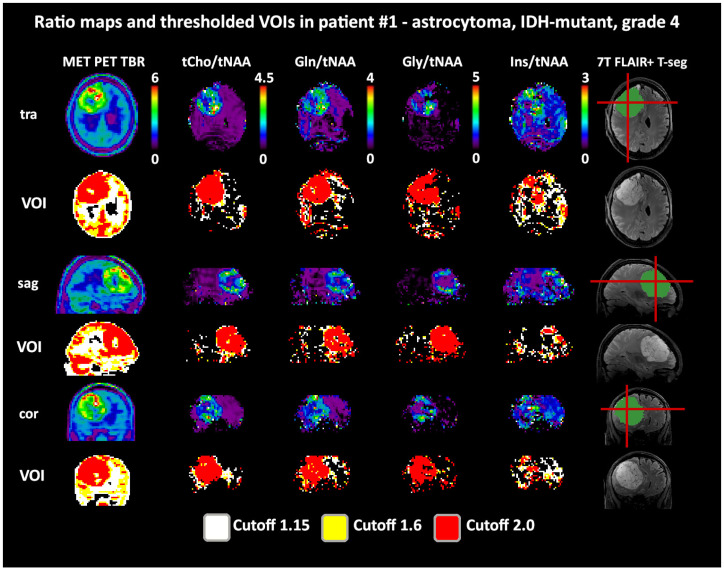
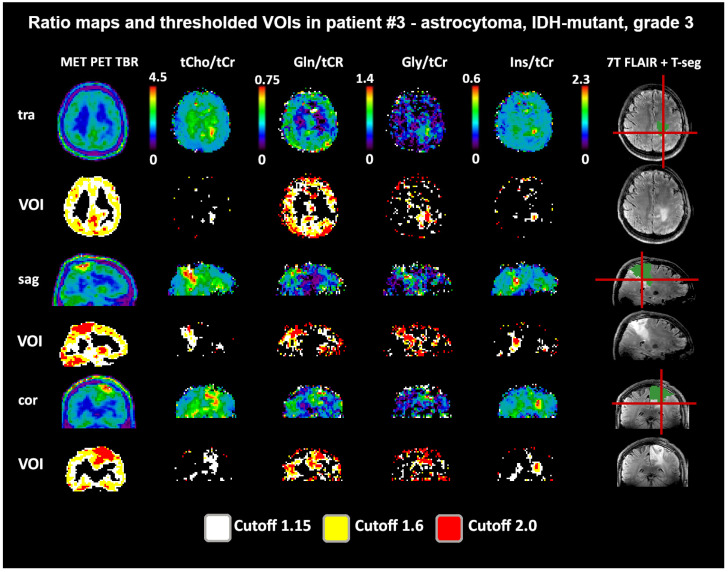
(1) Background: Recent developments in 7T magnetic resonance spectroscopic imaging (MRSI) made the acquisition of high-resolution metabolic images in clinically feasible measurement times possible. The amino acids glutamine (Gln) and glycine (Gly) were identified as potential neuro-oncological markers of importance. For the first time, we compared 7T MRSI to amino acid PET in a cohort of glioma patients. (2) Methods: In 24 patients, we co-registered 7T MRSI and routine PET and compared hotspot volumes of interest (VOI). We evaluated dice similarity coefficients (DSC), volume, center of intensity distance (CoI), median and threshold values for VOIs of PET and ratios of total choline (tCho), Gln, Gly, myo-inositol (Ins) to total N-acetylaspartate (tNAA) or total creatine (tCr). (3) Results: We found that Gln and Gly ratios generally resulted in a higher correspondence to PET than tCho. Using cutoffs of 1.6-times median values of a control region, DSCs to PET were 0.53 ± 0.36 for tCho/tNAA, 0.66 ± 0.40 for Gln/tNAA, 0.57 ± 0.36 for Gly/tNAA, and 0.38 ± 0.31 for Ins/tNAA. (4) Conclusions: Our 7T MRSI data corresponded better to PET than previous studies at lower fields. Our results for Gln and Gly highlight the importance of future research (e.g., using Gln PET tracers) into the role of both amino acids.
Keywords: 7T; MR spectroscopy; MRSI; PET; choline; gliomas; glutamine; glycine.
Conflict of interest statement
M.P. has received honoraria for lectures, consultation, or advisory board participation from the following for-profit companies: Bayer; Bristol-Myers Squibb; Novartis; Gerson Lehrman Group (GLG); CMC Contrast; GlaxoSmithKline; Mundipharma; Roche; BMJ Journals; MedMedia; Astra Zeneca; AbbVie, Lilly; Medahead; Daiichi Sankyo; Sanofi; Merck Sharp & Dohme; Tocagen; Adastra; Gan & Lee Pharmaceuticals. The following for-profit companies have supported clinical trials and contracted research conducted by M.P., with payments made to his institution: Böhringer-Ingelheim; Bristol-Myers Squibb; Roche; Daiichi Sankyo; Merck Sharp & Dohme; Novocure; GlaxoSmithKline; AbbVie.
Figures
Similar articles
-
A Comparison of 7 Tesla MR Spectroscopic Imaging and 3 Tesla MR Fingerprinting for Tumor Localization in Glioma Patients.Cancers (Basel). 2024 Feb 26;16(5):943. doi: 10.3390/cancers16050943. Cancers (Basel). 2024. PMID: 38473305 Free PMC article.
-
High-resolution metabolic imaging of high-grade gliomas using 7T-CRT-FID-MRSI.Neuroimage Clin. 2020;28:102433. doi: 10.1016/j.nicl.2020.102433. Epub 2020 Sep 15. Neuroimage Clin. 2020. PMID: 32977210 Free PMC article.
-
Magnetic resonance spectroscopy as marker for neurodegeneration in X-linked adrenoleukodystrophy.Neuroimage Clin. 2021;32:102793. doi: 10.1016/j.nicl.2021.102793. Epub 2021 Aug 24. Neuroimage Clin. 2021. PMID: 34461432 Free PMC article.
-
Meta-analysis of brain metabolite differences in HIV infection.Neuroimage Clin. 2020;28:102436. doi: 10.1016/j.nicl.2020.102436. Epub 2020 Sep 15. Neuroimage Clin. 2020. PMID: 33383609 Free PMC article. Review.
-
Application of 7T MRS to High-Grade Gliomas.AJNR Am J Neuroradiol. 2022 Oct;43(10):1378-1395. doi: 10.3174/ajnr.A7502. Epub 2022 May 26. AJNR Am J Neuroradiol. 2022. PMID: 35618424 Free PMC article. Review.
Cited by
-
A Comparison of 7 Tesla MR Spectroscopic Imaging and 3 Tesla MR Fingerprinting for Tumor Localization in Glioma Patients.Cancers (Basel). 2024 Feb 26;16(5):943. doi: 10.3390/cancers16050943. Cancers (Basel). 2024. PMID: 38473305 Free PMC article.
-
Advancements in Image-Based Models for High-Grade Gliomas Might Be Accelerated.Cancers (Basel). 2024 Apr 19;16(8):1566. doi: 10.3390/cancers16081566. Cancers (Basel). 2024. PMID: 38672647 Free PMC article. Review.
-
Ultrahigh-field MRI: where it really makes a difference.Radiologie (Heidelb). 2024 Nov;64(Suppl 1):1-8. doi: 10.1007/s00117-023-01184-x. Epub 2023 Aug 16. Radiologie (Heidelb). 2024. PMID: 37584681 Free PMC article. Review.
-
Advances in the Radiological Evaluation of and Theranostics for Glioblastoma.Cancers (Basel). 2023 Aug 18;15(16):4162. doi: 10.3390/cancers15164162. Cancers (Basel). 2023. PMID: 37627190 Free PMC article. Review.
References
-
- Motyka S., Moser P., Hingerl L., Hangel G., Heckova E., Strasser B., Eckstein K., Daniel Robinson S., Poser B.A., Gruber S., et al. The influence of spatial resolution on the spectral quality and quantification accuracy of whole-brain MRSI at 1.5T, 3T, 7T, and 9.4T. Magn. Reson. Med. 2019;82:551–565. doi: 10.1002/mrm.27746. - DOI - PMC - PubMed
Grants and funding
LinkOut - more resources
Full Text Sources
