. 2022 Apr 26;14(9):2166.
doi: 10.3390/cancers14092166.

RB1-Negative Retinal Organoids Display Proliferation of Cone Photoreceptors and Loss of Retinal Differentiation

Affiliations

RB1-Negative Retinal Organoids Display Proliferation of Cone Photoreceptors and Loss of Retinal Differentiation

Deniz Kanber et al. Cancers (Basel). .

Abstract

Retinoblastoma is a tumor of the eye in children under the age of five caused by biallelic inactivation of the RB1 tumor suppressor gene in maturing retinal cells. Cancer models are essential for understanding tumor development and in preclinical research. Because of the complex organization of the human retina, such models were challenging to develop for retinoblastoma. Here, we present an organoid model based on differentiation of human embryonic stem cells into neural retina after inactivation of RB1 by CRISPR/Cas9 mutagenesis. Wildtype and RB1 heterozygous mutant retinal organoids were indistinguishable with respect to morphology, temporal development of retinal cell types and global mRNA expression. However, loss of pRB resulted in spatially disorganized organoids and aberrant differentiation, indicated by disintegration of organoids beyond day 130 of differentiation and depletion of most retinal cell types. Only cone photoreceptors were abundant and continued to proliferate, supporting these as candidate cells-of-origin for retinoblastoma. Transcriptome analysis of RB1 knockout organoids and primary retinoblastoma revealed gain of a retinoblastoma expression signature in the organoids, characterized by upregulation of RBL1 (p107), MDM2, DEK, SYK and HELLS. In addition, genes related to immune response and extracellular matrix were specifically upregulated in RB1-negative organoids. In vitro retinal organoids therefore display some features associated with retinoblastoma and, so far, represent the only valid human cancer model for the development of this disease.

Keywords: RNA-seq; retinal organoids; retinoblastoma; stem cells.


Conflict of interest statement

The authors declare no conflict of interest. The funders had no role in the design of the study; in the collection, analyses, or interpretation of data; in the writing of the manuscript, or in the decision to publish the results.

Figures
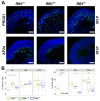
Figure 1
Figure 1
Amacrine and horizontal cells in differentiating retinal organoids. (A) Representative images of immunofluorescent staining of organoids at d126 for marker proteins PROX1 (horizontal cells) and AP2α (amacrine cells) (green). Nuclei were counterstained with DAPI (blue). Scale bar 50 μm. (B) Quantification of PROX1- and AP2α-positive cells based on microscopy images. Percentages of marker-positive cells per total DAPI-positive area are given. * p ≤ 0.05, ** p ≤ 0.01, **** p ≤ 0.0001.
Figure 2
Figure 2
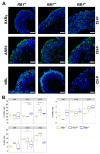
Cone and rod photoreceptors at d152. (A) Representative images of immunofluorescent staining of cells expressing RXRγ (immature cone marker), ARR3 (maturing cone marker), NRL (early rod marker). Marker proteins in green, nuclei counterstained with DAPI (blue). Scale bar 50 μm. (B) Quantification of RXRγ- and ARR3-positive cone photoreceptors and NRL-positive rod photoreceptors based on microscopy images. Percentages of marker-positive cells per total DAPI-positive area are given. * p ≤ 0.05, ** p ≤ 0.01, *** p ≤ 0.001.
Figure 3
Figure 3
RB1ko organoids develop proliferating RXRγ- or ARR3-positive cone photoreceptors. (A) Representative images of co-immunofluorescent staining of cone marker proteins RXRγ and ARR3 (green) with Ki67 (red) at d152 of differentiation. Arrows indicate double-positive cells. Nuclei were counterstained with DAPI (blue). Scale bar 50 μm. (B) Quantification of cells staining positive for cone marker proteins and Ki67. The percentage of double-positive area normalized to cone marker-positive area is given. * p ≤ 0.05, ** p ≤ 0.01, *** p ≤ 0.001.
Figure 4
Figure 4
RB1ko organoids exhibit proliferating LM- or S-opsin-positive photoreceptors. (A) Representative images of co-immunofluorescent staining of cone marker proteins LM-opsin or S-opsin (green) with Ki67 (red) at d152 of differentiation. Arrows indicate double-positive cells. Nuclei were counterstained with DAPI (blue). Scale bar 50 μm. (B) Quantification of cells staining positive for cone marker proteins and Ki67. The percentage of double-positive area normalized to cone marker-positive area is given. * p ≤ 0.05, ** p ≤ 0.01, *** p ≤ 0.001.
Figure 5
Figure 5
Transcriptome analysis revealed impaired retinal differentiation in RB1ko after d35. (A) Principal component analysis. Color: time point (blue d35, grey d96, black d152), symbols: genotype (triangle: RB1ko, dot: RB1het, square: RB1wt, filled: H9_RB1ex3, open: H9_RB1ex1). (B) DEG analysis of RB1wt d35 versus d152 using log2(FC) > 1, p-adjust < 0.05 for filtering. Heatmap shows 7254 genes clustered into c1 to c4. Expression of the identified DEGs in RB1het and RB1ko was plotted. (C) Top 5 (p-adjust < 0.05) enriched biological processes per cluster determined by reduced redundancy GO analysis. The total number of DEGs in each cluster associated with a GO-term is given in parentheses, dot size: ratio of number of DEGs present in the specific GO-term versus total number GO-term associated DEGs in this cluster, dot color: p-adjust. If any of the top 5 terms of one cluster is present in another cluster, corresponding dots are plotted. (D) Gene expression of marker genes for retinal differentiation (normalized counts, scaling per row). Black/blue: genes identified/not identified as DEGs in multiparametric analysis (Figure 6).
Figure 6
Figure 6
Multiparametric analysis of differential gene expression in retinal differentiation. (A) Multiparametric analysis considering genotype (RB1wt/het versus RB1ko), day of differentiation and batch effects of independent experiments. DEGs were filtered by p-adjust < 0.05 and log2FC > 1. Filtered DEGs were assigned to 10 clusters. Expression of genes in clusters over time is shown. (B) Top 5 (p-adjust < 0.05) enriched biological processes per cluster determined by reduced redundancy GO analysis. The total number of DEGs in each cluster associated with a GO-term is given in parentheses, dot size: ratio of number of DEGs present in the specific GO-term versus total number of GO-term associated DEGs in this cluster, dot color: p-adjust. If any of the top 5 terms of one cluster is present in another cluster, corresponding dots are plotted.
Figure 7
Figure 7
RB1ko gain retinoblastoma signature during differentiation. (A) Data of tumor samples sequenced. Age@dx: age at diagnosis in days after birth; 1st mt/2nd mt: first/second mutation in tumor (note: c.1 is A of ATG start codon of LRG_517t1). * indicates generation of translational stop codon. (B) DEGs were determined between fetal retina and retinoblastoma samples (p < 0.001, log2(FC) > 2). Expression of these genes in organoids at d152/d160 was plotted. Cluster analysis retrieved eight clusters. (C) Expression of 510 retinoblastoma signature genes in RB1ko. Log2(FC) values of the DEGs in RB1ko were normalized to log2(FC) values in RB1wt samples at d35, d96 and d152 of differentiation; expression in the five tumor samples was normalized to public data for fetal retina. (D) Gene expression (normalized counts, scaling per row) of genes associated with retinoblastoma as observed in retinal organoids and tumor samples. Black/blue: genes identified/not identified as DEGs in multiparametric analysis (Figure 6).

Similar articles

Cited by

References

    1. Gröbner S.N., Worst B.C., Weischenfeldt J., Buchhalter I., Kleinheinz K., Rudneva V.A., Johann P.D., Balasubramanian G.P., Segura-Wang M., Brabetz S., et al. The landscape of genomic alterations across childhood cancers. Nature. 2018;555:321–327. doi: 10.1038/nature25480. - DOI - PubMed
    1. Kooi I.E., Mol B.M., Massink M.P., Ameziane N., Meijers-Heijboer H., Dommering C.J., van Mil S.E., de Vries Y., van der Hout A.H., Kaspers G.J., et al. Somatic genomic alterations in retinoblastoma beyond RB1 are rare and limited to copy number changes. Sci. Rep. 2016;6:25264. doi: 10.1038/srep25264. - DOI - PMC - PubMed
    1. Zhang J., Benavente C.A., McEvoy J., Flores-Otero J., Ding L., Chen X., Ulyanov A., Wu G., Wilson M., Wang J., et al. A novel retinoblastoma therapy from genomic and epigenetic analyses. Nature. 2012;481:329–334. doi: 10.1038/nature10733. - DOI - PMC - PubMed
    1. Rushlow D.E., Mol B.M., Kennett J.Y., Yee S., Pajovic S., Thériault B.L., Prigoda-Lee N.L., Spencer C., Dimaras H., Corson T.W., et al. Characterisation of retinoblastomas without RB1 mutations: Genomic, gene expression, and clinical studies. Lancet Oncol. 2013;14:327–334. doi: 10.1016/S1470-2045(13)70045-7. - DOI - PubMed
    1. Ganguly A., Shields C.L. Differential gene expression profile of retinoblastoma compared to normal retina. Mol. Vis. 2010;16:1292–1303. - PMC - PubMed