

Arginine Methyltransferase PRMT7 Deregulates Expression of RUNX1 Target Genes in T-Cell Acute Lymphoblastic Leukemia
- PMID: 35565298
- PMCID: PMC9101393
- DOI: 10.3390/cancers14092169
Arginine Methyltransferase PRMT7 Deregulates Expression of RUNX1 Target Genes in T-Cell Acute Lymphoblastic Leukemia
Abstract
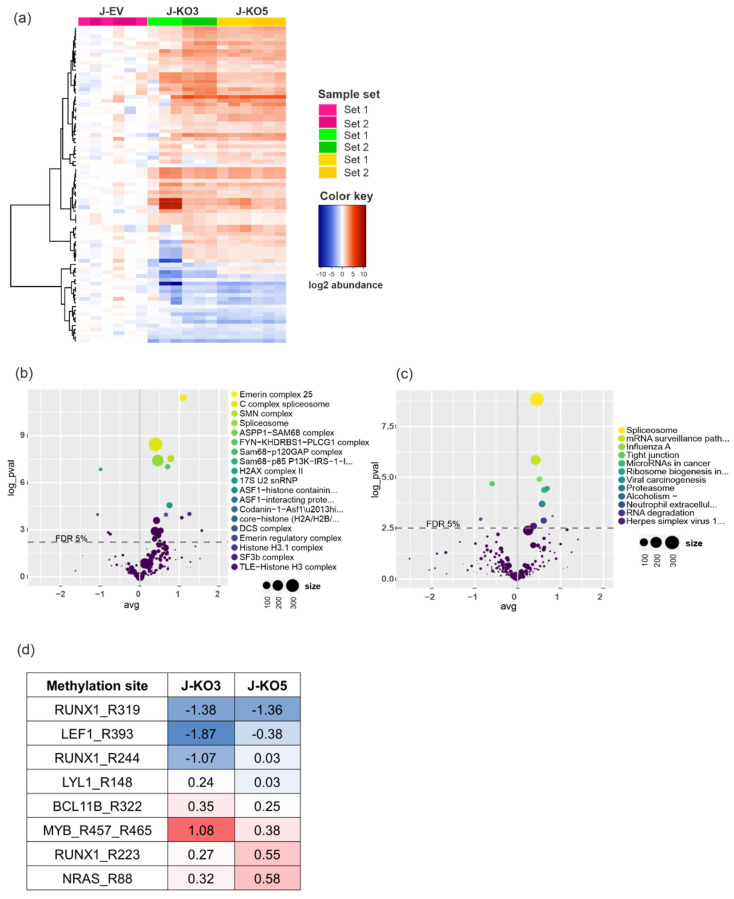
T-cell acute lymphoblastic leukemia (T-ALL) is an aggressive hematological malignancy with no well-established prognostic biomarkers. We examined the expression of protein arginine methyltransferases across hematological malignancies and discovered high levels of PRMT7 mRNA in T-ALL, particularly in the mature subtypes of T-ALL. The genetic deletion of PRMT7 by CRISPR-Cas9 reduced the colony formation of T-ALL cells and changed arginine monomethylation patterns in protein complexes associated with the RNA and DNA processing and the T-ALL pathogenesis. Among them was RUNX1, whose target gene expression was consequently deregulated. These results suggest that PRMT7 plays an active role in the pathogenesis of T-ALL.
Keywords: Leukemia; PRMT7; RUNX1; T-ALL; arginine methylation.
Conflict of interest statement
Declare conflicts of interest or state. The authors declare no conflict of interest. The funders had no role in the design of the study; in the collection, analyses, or interpretation of data; in the writing of the manuscript, or in the decision to publish the results.
Figures


Similar articles
-
Histone Arginine Methylation by PRMT7 Controls Germinal Center Formation via Regulating Bcl6 Transcription.J Immunol. 2015 Aug 15;195(4):1538-47. doi: 10.4049/jimmunol.1500224. Epub 2015 Jul 15. J Immunol. 2015. PMID: 26179907
-
The testis-specific factor CTCFL cooperates with the protein methyltransferase PRMT7 in H19 imprinting control region methylation.PLoS Biol. 2006 Oct;4(11):e355. doi: 10.1371/journal.pbio.0040355. PLoS Biol. 2006. PMID: 17048991 Free PMC article.
-
Arginine monomethylation by PRMT7 controls MAVS-mediated antiviral innate immunity.Mol Cell. 2021 Aug 5;81(15):3171-3186.e8. doi: 10.1016/j.molcel.2021.06.004. Epub 2021 Jun 24. Mol Cell. 2021. PMID: 34171297
-
Structure and Function of Protein Arginine Methyltransferase PRMT7.Life (Basel). 2021 Jul 30;11(8):768. doi: 10.3390/life11080768. Life (Basel). 2021. PMID: 34440512 Free PMC article. Review.
-
PRMT7: A Pivotal Arginine Methyltransferase in Stem Cells and Development.Stem Cells Int. 2021 Oct 19;2021:6241600. doi: 10.1155/2021/6241600. eCollection 2021. Stem Cells Int. 2021. PMID: 34712331 Free PMC article. Review.
Cited by
-
Prevalence of and gene regulatory constraints on transcriptional adaptation in single cells.bioRxiv [Preprint]. 2023 Nov 30:2023.08.14.553318. doi: 10.1101/2023.08.14.553318. bioRxiv. 2023. Update in: Genome Biol. 2024 Aug 12;25(1):217. doi: 10.1186/s13059-024-03351-2. PMID: 37645989 Free PMC article. Updated. Preprint.
-
IGFBP2 secretion by mammary adipocytes limits breast cancer invasion.Sci Adv. 2023 Jul 14;9(28):eadg1840. doi: 10.1126/sciadv.adg1840. Epub 2023 Jul 12. Sci Adv. 2023. PMID: 37436978 Free PMC article.
-
Current and Emerging Therapies for Targeting Protein Arginine Methyltransferases (PRMTs) in Cancer.Int J Mol Sci. 2025 Aug 16;26(16):7907. doi: 10.3390/ijms26167907. Int J Mol Sci. 2025. PMID: 40869229 Free PMC article. Review.
-
Prevalence of and gene regulatory constraints on transcriptional adaptation in single cells.Genome Biol. 2024 Aug 12;25(1):217. doi: 10.1186/s13059-024-03351-2. Genome Biol. 2024. PMID: 39135102 Free PMC article.
-
PRMT7 can prevent neurovascular uncoupling, blood-brain barrier permeability, and mitochondrial dysfunction in repetitive and mild traumatic brain injury.Exp Neurol. 2023 Aug;366:114445. doi: 10.1016/j.expneurol.2023.114445. Epub 2023 May 15. Exp Neurol. 2023. PMID: 37196697 Free PMC article.
References
-
- Quist-Paulsen P., Toft N., Heyman M., Abrahamsson J., Griškevičius L., Hallböök H., Jónsson Ó.G., Palk K., Vaitkeviciene G., Vettenranta K., et al. T-Cell Acute Lymphoblastic Leukemia in Patients 1–45 Years Treated with the Pediatric NOPHO ALL2008 Protocol. Leukemia. 2020;34:347–357. doi: 10.1038/s41375-019-0598-2. - DOI - PubMed
-
- Schrappe M., Valsecchi M.G., Bartram C.R., Schrauder A., Panzer-Grümayer R., Möricke A., Parasole R., Zimmermann M., Dworzak M., Buldini B., et al. Late MRD Response Determines Relapse Risk Overall and in Subsets of Childhood T-Cell ALL: Results of the AIEOP-BFM-ALL 2000 Study. Blood. 2011;118:2077–2084. doi: 10.1182/blood-2011-03-338707. - DOI - PubMed
-
- Winter S.S., Dunsmore K.P., Devidas M., Wood B.L., Esiashvili N., Chen Z., Eisenberg N., Briegel N., Hayashi R.J., Gastier-Foster J.M., et al. Improved Survival for Children and Young Adults with T-Lineage Acute Lymphoblastic Leukemia: Results from the Children’s Oncology Group AALL0434 Methotrexate Randomization. J. Clin. Oncol. 2018;36:2926–2934. doi: 10.1200/JCO.2018.77.7250. - DOI - PMC - PubMed
LinkOut - more resources
Full Text Sources
Molecular Biology Databases
