

EMT, Stemness, and Drug Resistance in Biological Context: A 3D Tumor Tissue/In Silico Platform for Analysis of Combinatorial Treatment in NSCLC with Aggressive KRAS-Biomarker Signatures
- PMID: 35565305
- PMCID: PMC9099837
- DOI: 10.3390/cancers14092176
EMT, Stemness, and Drug Resistance in Biological Context: A 3D Tumor Tissue/In Silico Platform for Analysis of Combinatorial Treatment in NSCLC with Aggressive KRAS-Biomarker Signatures
Abstract
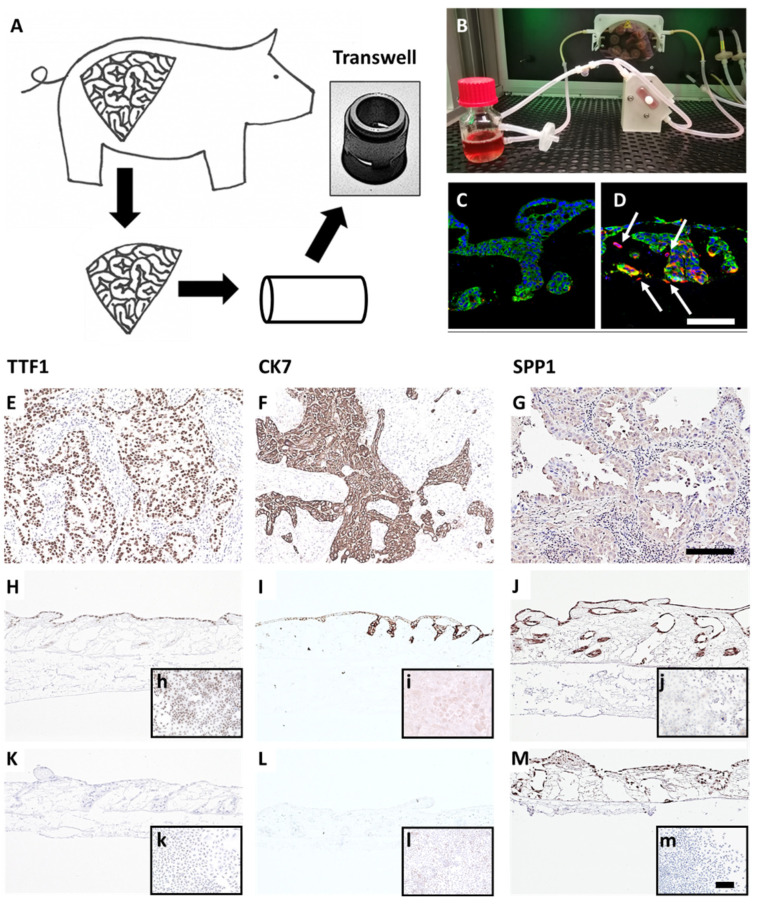
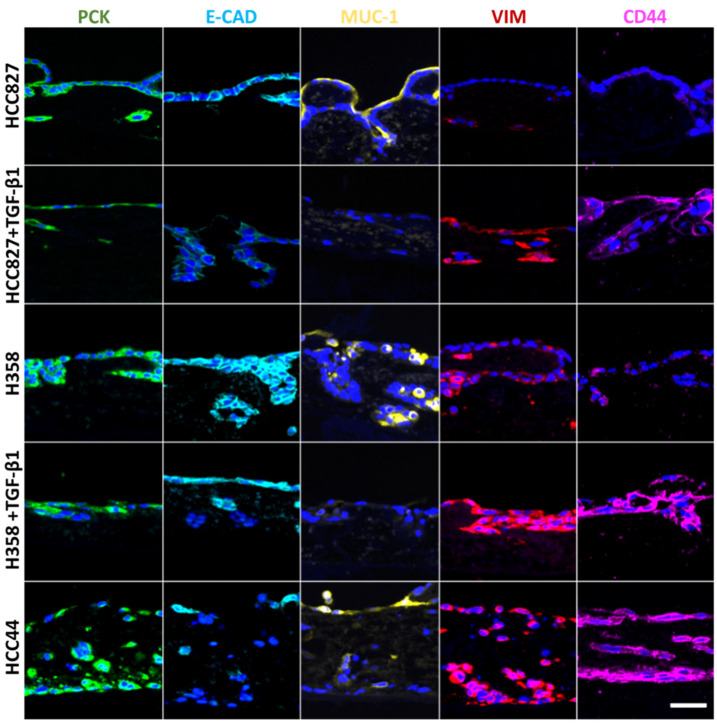
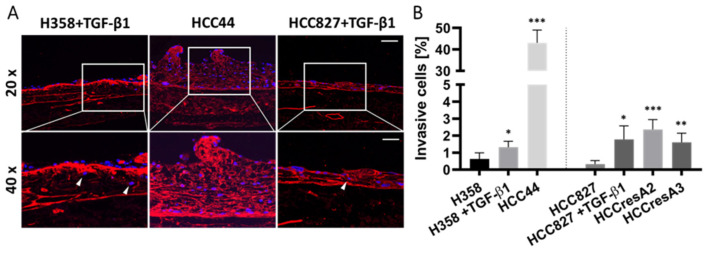
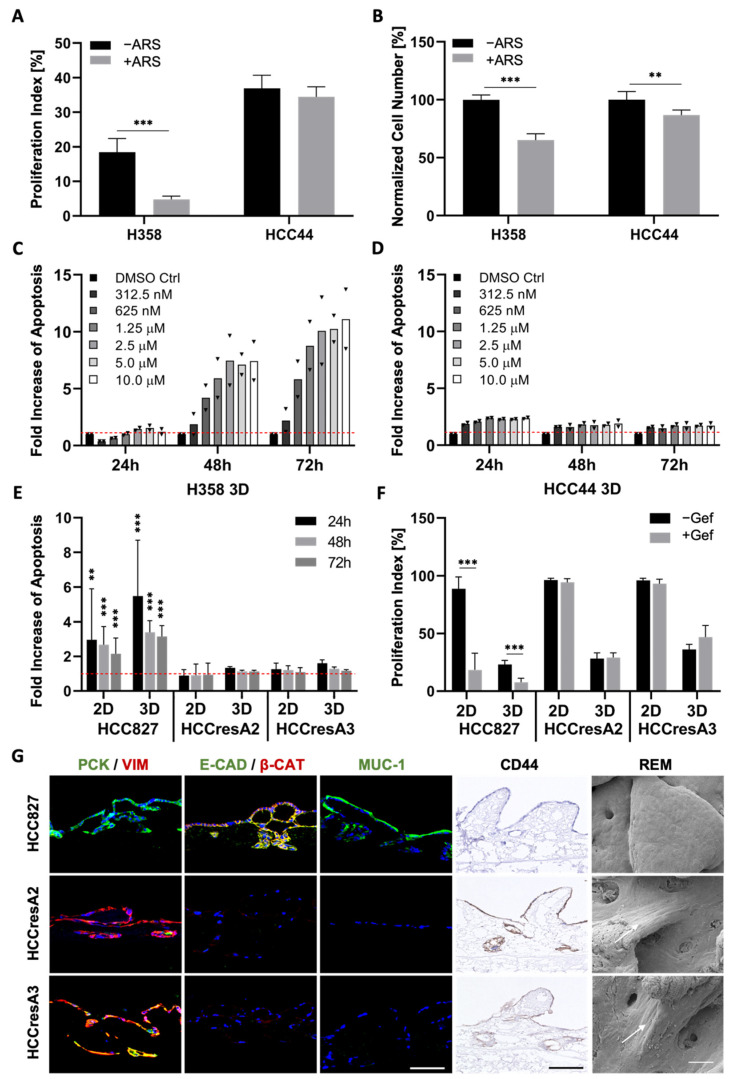
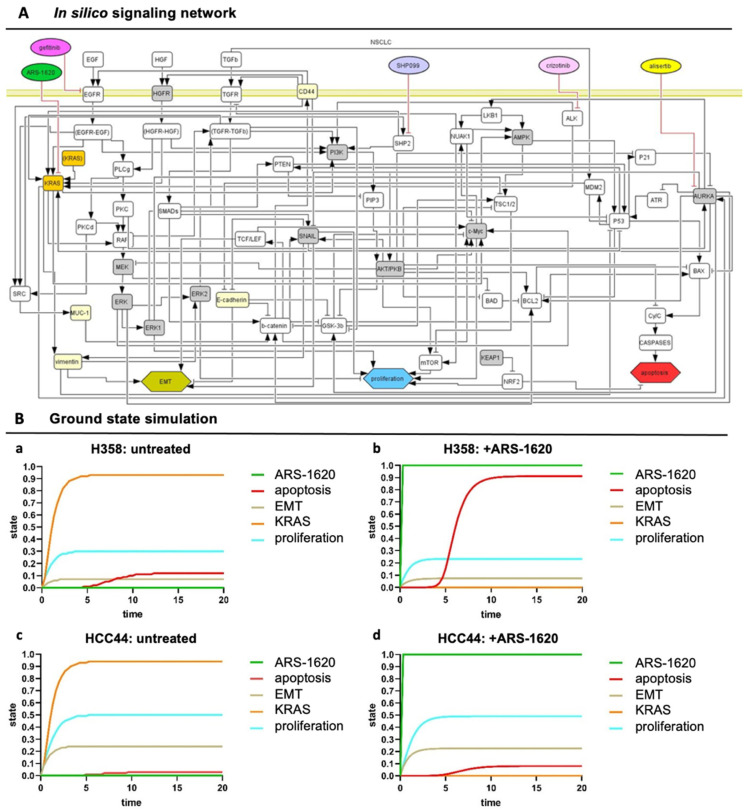
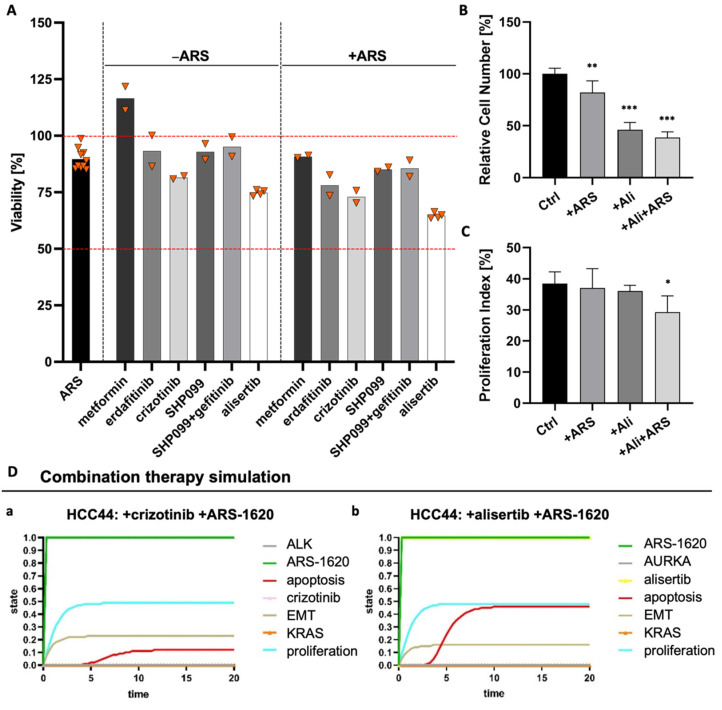
Epithelial-to-mesenchymal transition (EMT) is discussed to be centrally involved in invasion, stemness, and drug resistance. Experimental models to evaluate this process in its biological complexity are limited. To shed light on EMT impact and test drug response more reliably, we use a lung tumor test system based on a decellularized intestinal matrix showing more in vivo-like proliferation levels and enhanced expression of clinical markers and carcinogenesis-related genes. In our models, we found evidence for a correlation of EMT with drug resistance in primary and secondary resistant cells harboring KRASG12C or EGFR mutations, which was simulated in silico based on an optimized signaling network topology. Notably, drug resistance did not correlate with EMT status in KRAS-mutated patient-derived xenograft (PDX) cell lines, and drug efficacy was not affected by EMT induction via TGF-β. To investigate further determinants of drug response, we tested several drugs in combination with a KRASG12C inhibitor in KRASG12C mutant HCC44 models, which, besides EMT, display mutations in P53, LKB1, KEAP1, and high c-MYC expression. We identified an aurora-kinase A (AURKA) inhibitor as the most promising candidate. In our network, AURKA is a centrally linked hub to EMT, proliferation, apoptosis, LKB1, and c-MYC. This exemplifies our systemic analysis approach for clinical translation of biomarker signatures.
Keywords: 3D lung tumor tissue models; EMT; KRAS biomarker signatures; boolean in silico models; drug resistance; invasion; stemness; targeted combination therapy.
Conflict of interest statement
The authors declare no conflict of interest.
Figures
Similar articles
-
Epithelial-to-Mesenchymal Transition is a Cause of Both Intrinsic and Acquired Resistance to KRAS G12C Inhibitor in KRAS G12C-Mutant Non-Small Cell Lung Cancer.Clin Cancer Res. 2020 Nov 15;26(22):5962-5973. doi: 10.1158/1078-0432.CCR-20-2077. Epub 2020 Sep 8. Clin Cancer Res. 2020. PMID: 32900796
-
A Combined 3D Tissue Engineered In Vitro/In Silico Lung Tumor Model for Predicting Drug Effectiveness in Specific Mutational Backgrounds.J Vis Exp. 2016 Apr 6;(110):e53885. doi: 10.3791/53885. J Vis Exp. 2016. PMID: 27077967 Free PMC article.
-
Targeting ST8SIA6-AS1 counteracts KRASG12C inhibitor resistance through abolishing the reciprocal activation of PLK1/c-Myc signaling.Exp Hematol Oncol. 2023 Dec 16;12(1):105. doi: 10.1186/s40164-023-00466-3. Exp Hematol Oncol. 2023. PMID: 38104151 Free PMC article.
-
Non-genetic adaptive resistance to KRASG12C inhibition: EMT is not the only culprit.Front Oncol. 2022 Nov 22;12:1004669. doi: 10.3389/fonc.2022.1004669. eCollection 2022. Front Oncol. 2022. PMID: 36483040 Free PMC article. Review.
-
Key roles of EMT for adaptive resistance to MEK inhibitor in KRAS mutant lung cancer.Small GTPases. 2017 Jul 3;8(3):172-176. doi: 10.1080/21541248.2016.1210369. Epub 2016 Jul 8. Small GTPases. 2017. PMID: 27392325 Free PMC article. Review.
Cited by
-
Tumor Models and Drug Targeting In Vitro-Where Are We Today? Where Do We Go from Here?Cancers (Basel). 2023 Mar 15;15(6):1768. doi: 10.3390/cancers15061768. Cancers (Basel). 2023. PMID: 36980654 Free PMC article.
-
Single-cell and spatial transcriptome sequencing uncover a platinum-resistant cluster overexpressed TACSTD2 in high-grade serous ovarian cancer.J Cancer. 2024 Apr 29;15(11):3427-3440. doi: 10.7150/jca.95269. eCollection 2024. J Cancer. 2024. PMID: 38817863 Free PMC article.
-
Cat-E: A comprehensive web tool for exploring cancer targeting strategies.Comput Struct Biotechnol J. 2024 Mar 27;23:1376-1386. doi: 10.1016/j.csbj.2024.03.024. eCollection 2024 Dec. Comput Struct Biotechnol J. 2024. PMID: 38596315 Free PMC article.
-
DataXflow: Synergizing data-driven modeling with best parameter fit and optimal control - An efficient data analysis for cancer research.Comput Struct Biotechnol J. 2024 Apr 8;23:1755-1772. doi: 10.1016/j.csbj.2024.04.010. eCollection 2024 Dec. Comput Struct Biotechnol J. 2024. PMID: 38707537 Free PMC article.
-
The FGFR inhibitor pemigatinib overcomes cancer drug resistance to KRAS G12C inhibitors in mesenchymal lung cancer.PLoS One. 2025 Aug 11;20(8):e0327588. doi: 10.1371/journal.pone.0327588. eCollection 2025. PLoS One. 2025. PMID: 40788860 Free PMC article.
References
-
- Brabletz T., Hlubek F., Spaderna S., Schmalhofer O., Hiendlmeyer E., Jung A., Kirchner T. Invasion and metastasis in colorectal cancer: Epithelial-mesenchymal transition, mesenchymal-epithelial transition, stem cells and beta-catenin. Cells Tissues Organs. 2005;179:56–65. doi: 10.1159/000084509. - DOI - PubMed
Grants and funding
LinkOut - more resources
Full Text Sources
Research Materials
Miscellaneous
