

Putative Clinical Potential of ERBB2 Amplification Assessment by ddPCR in FFPE-DNA and cfDNA of Gastroesophageal Adenocarcinoma Patients
- PMID: 35565309
- PMCID: PMC9102116
- DOI: 10.3390/cancers14092180
Putative Clinical Potential of ERBB2 Amplification Assessment by ddPCR in FFPE-DNA and cfDNA of Gastroesophageal Adenocarcinoma Patients
Abstract
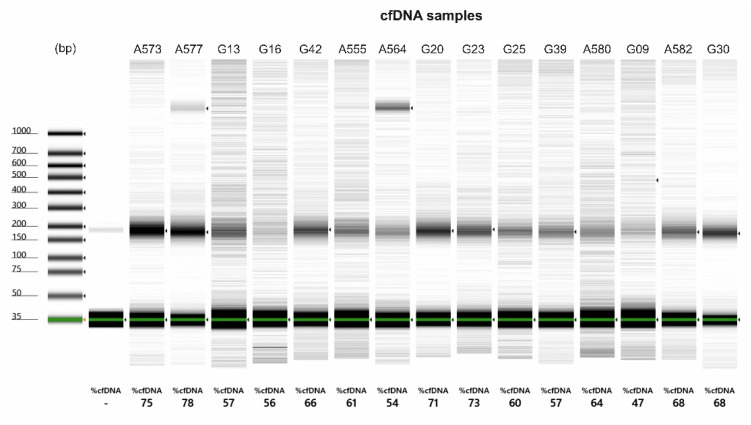
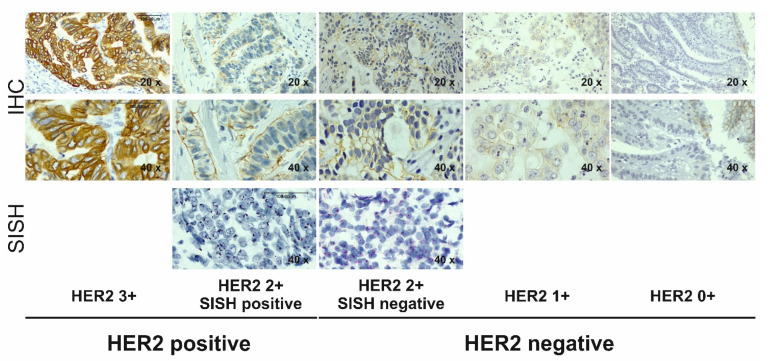
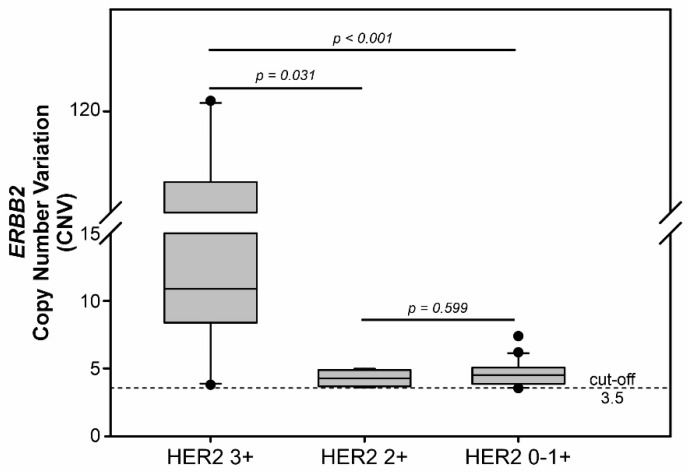
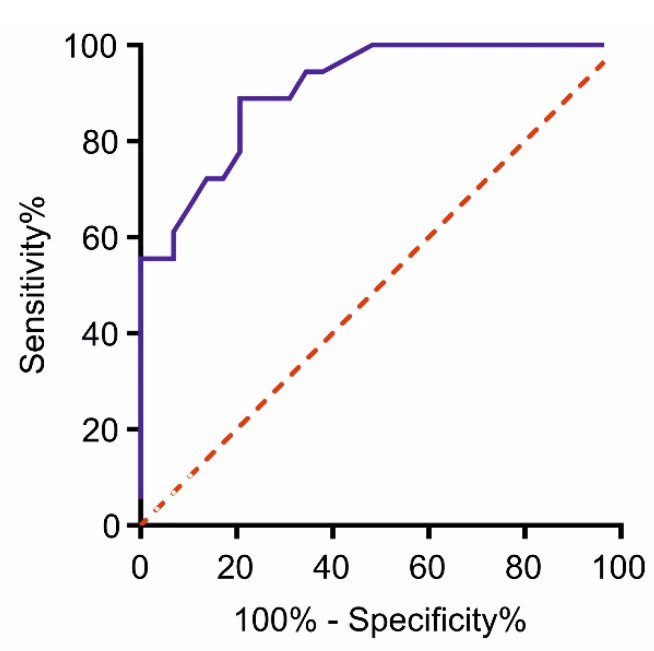
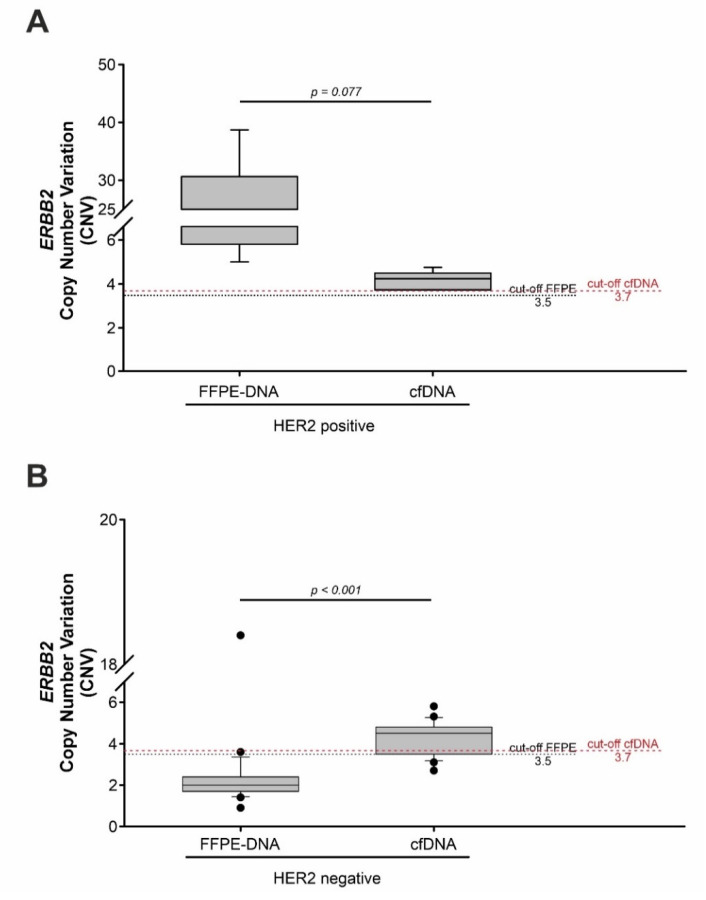
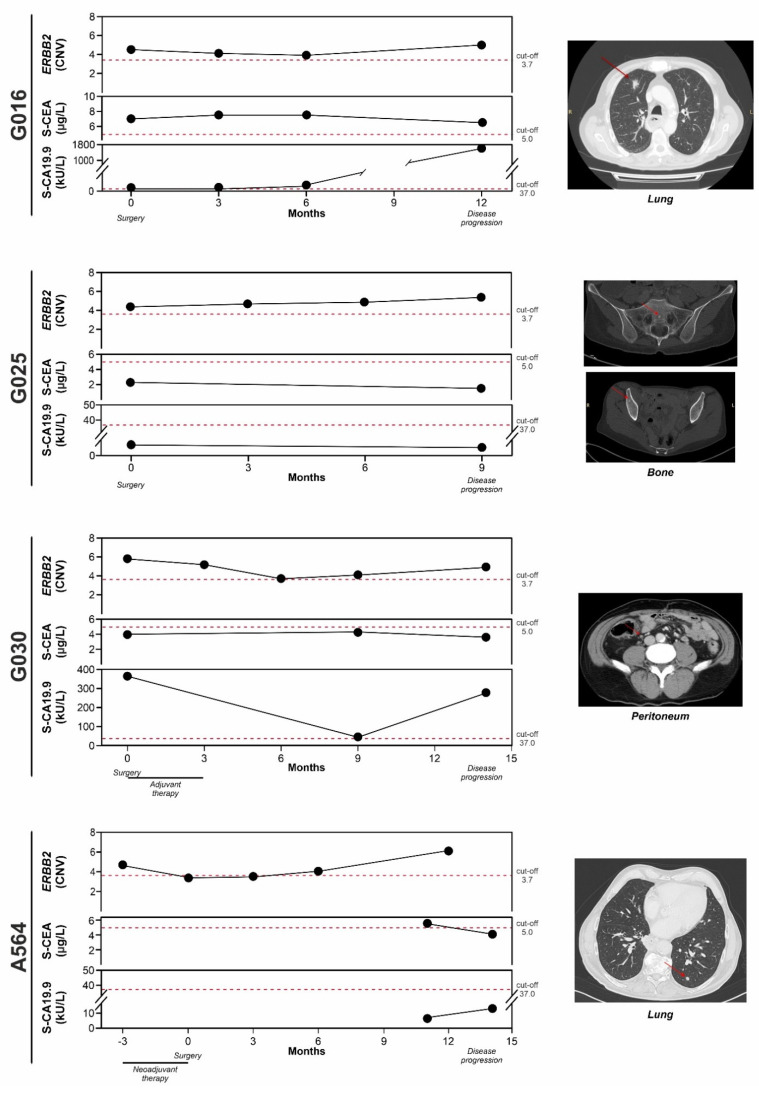
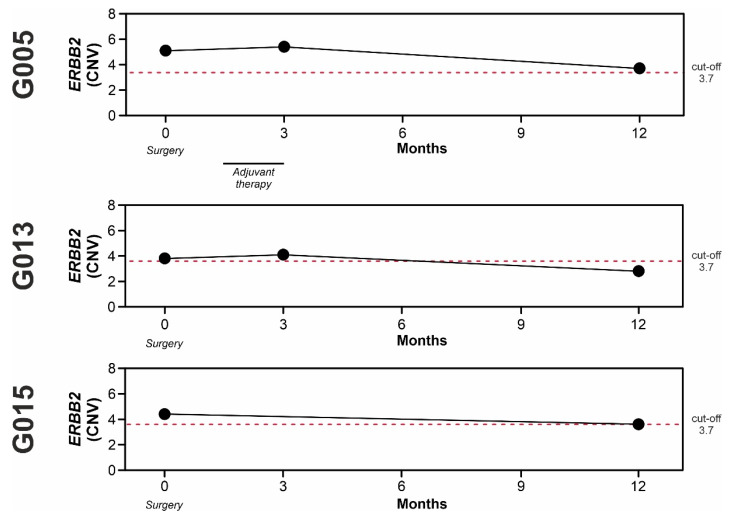
Anti-HER2 monoclonal antibody trastuzumab improves the survival of those patients with advanced gastroesophageal adenocarcinoma (GEA) exhibiting HER2/ERBB2 overexpression/amplification. The current gold standard methods used to diagnose the HER2 status in GEA are immunohistochemistry (IHC) and silver or fluorescence in situ hybridization (SISH or FISH). However, they do not permit spatial and temporal tumor monitoring, nor do they overcome intra-cancer heterogeneity. Droplet digital PCR (ddPCR) was used to implement the assessment of HER2 status in formalin-fixed paraffin-embedded (FFPE) tumor DNA from a retrospective cohort (86 patients) and in cell-free DNA (cfDNA) samples from a prospective cohort (28 patients). In comparison to IHC/SISH, ddPCR assay revealed ERBB2 amplification in a larger patient fraction, including HER2 2+ and 0-1+ of the retrospective cohort (45.3% vs. 15.1%). In addition, a considerable number of HER2 2+ and 0-1+ prospective patients who were negative in FFPE by both IHC/SISH and ddPCR, showed ERBB2 amplification in the cfDNA collected just before surgery. cfDNA analysis in a few longitudinal cases revealed an increasing ERBB2 trend at progression. In conclusion, ddPCR in liquid biopsy may improve the detection rate of HER2 positive patients, preventing those patients who could benefit from targeted therapy from being incorrectly excluded.
Keywords: ERBB2; HER2; cell-free DNA (cfDNA); droplet digital PCR (ddPCR); gastroesophageal adenocarcinoma; liquid biopsy.
Conflict of interest statement
The authors declare no conflict of interest.
Figures
Similar articles
-
Droplet digital polymerase chain reaction detection of HER2 amplification in formalin fixed paraffin embedded breast and gastric carcinoma samples.Exp Mol Pathol. 2016 Apr;100(2):287-93. doi: 10.1016/j.yexmp.2015.11.027. Epub 2015 Nov 25. Exp Mol Pathol. 2016. PMID: 26626802
-
MSI Analysis in Solid and Liquid Biopsies of Gastroesophageal Adenocarcinoma Patients: A Molecular Approach.Int J Mol Sci. 2021 Jul 6;22(14):7244. doi: 10.3390/ijms22147244. Int J Mol Sci. 2021. PMID: 34298864 Free PMC article.
-
Human epidermal growth factor receptor 2 amplification detection by droplet digital polymerase chain reaction in formalin-fixed paraffin-embedded breast and gastric cancer samples.J Cancer Res Ther. 2017;13(4):730-734. doi: 10.4103/jcrt.JCRT_587_17. J Cancer Res Ther. 2017. PMID: 28901323
-
[HER2 and gastric cancer: a novel therapeutic target for trastuzumab].Bull Cancer. 2010 Dec;97(12):1429-40. doi: 10.1684/bdc.2010.1224. Bull Cancer. 2010. PMID: 21134821 Review. French.
-
Clinical Utility of Liquid Biopsy-Based Actionable Mutations Detected via ddPCR.Biomedicines. 2021 Jul 28;9(8):906. doi: 10.3390/biomedicines9080906. Biomedicines. 2021. PMID: 34440110 Free PMC article. Review.
Cited by
-
p53/TP53 Status Assessment in Gastroesophageal Adenocarcinoma.Cancers (Basel). 2023 May 16;15(10):2783. doi: 10.3390/cancers15102783. Cancers (Basel). 2023. PMID: 37345120 Free PMC article.
-
Enhanced Risk Stratification in Early-Stage Endometrial Cancer: Integrating POLE through Droplet Digital PCR and L1CAM.Cancers (Basel). 2023 Oct 9;15(19):4899. doi: 10.3390/cancers15194899. Cancers (Basel). 2023. PMID: 37835593 Free PMC article.
-
Clinical evaluation of droplet digital PCR in the early identification of suspected sepsis patients in the emergency department: a prospective observational study.Front Cell Infect Microbiol. 2024 Jun 4;14:1358801. doi: 10.3389/fcimb.2024.1358801. eCollection 2024. Front Cell Infect Microbiol. 2024. PMID: 38895732 Free PMC article.
-
Etiology of lower respiratory tract in pneumonia based on metagenomic next-generation sequencing: a retrospective study.Front Cell Infect Microbiol. 2024 Jan 9;13:1291980. doi: 10.3389/fcimb.2023.1291980. eCollection 2023. Front Cell Infect Microbiol. 2024. PMID: 38264726 Free PMC article.
-
Clinical Diagnostic Performance of Droplet Digital PCR for Suspected Bloodstream Infections.Microbiol Spectr. 2023 Feb 14;11(1):e0137822. doi: 10.1128/spectrum.01378-22. Epub 2023 Jan 5. Microbiol Spectr. 2023. PMID: 36602351 Free PMC article.
References
-
- Al-Batran S.-E., Homann N., Pauligk C., Goetze T.O., Meiler J., Kasper S., Kopp H.-G., Mayer F., Haag G.M., Luley K., et al. Perioperative chemotherapy with fluorouracil plus leucovorin, oxaliplatin, and docetaxel versus fluorouracil or capecitabine plus cisplatin and epirubicin for locally advanced, resectable gastric or gastro-oesophageal junction adenocarcinoma (FLOT4): A randomized, phase 2/3 trial. Lancet. 2019;393:1948–1957. doi: 10.1016/S0140-6736(18)32557-1. - DOI - PubMed
-
- National Comprehensive Cancer Network (NCCN) Esophageal and Esophagogastric Junction Cancers, Version 4. Aug 3, 2021. [(accessed on 31 March 2022)]. Available online: https://www.nccn.org/guidelines/guidelines-detail?category=1&id=1433.
Grants and funding
LinkOut - more resources
Full Text Sources
Research Materials
Miscellaneous
