. 2022 May 3;14(9):2286.
doi: 10.3390/cancers14092286.

mRNA Subtype of Cancer-Associated Fibroblasts Significantly Affects Key Characteristics of Head and Neck Cancer Cells

Affiliations

mRNA Subtype of Cancer-Associated Fibroblasts Significantly Affects Key Characteristics of Head and Neck Cancer Cells

Barbora Peltanová et al. Cancers (Basel). .

Abstract

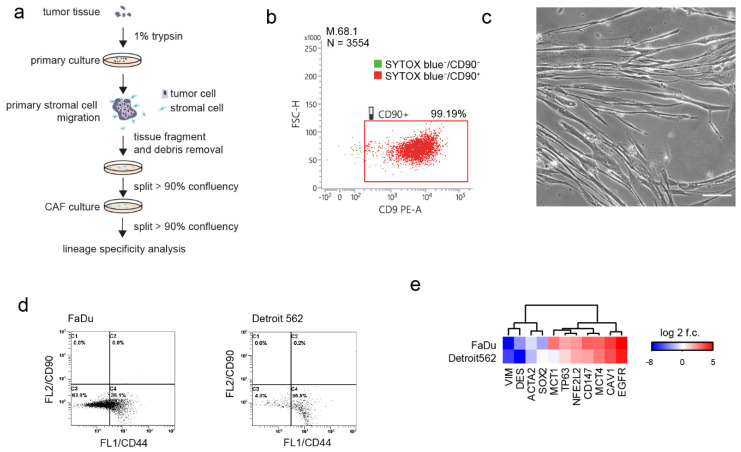
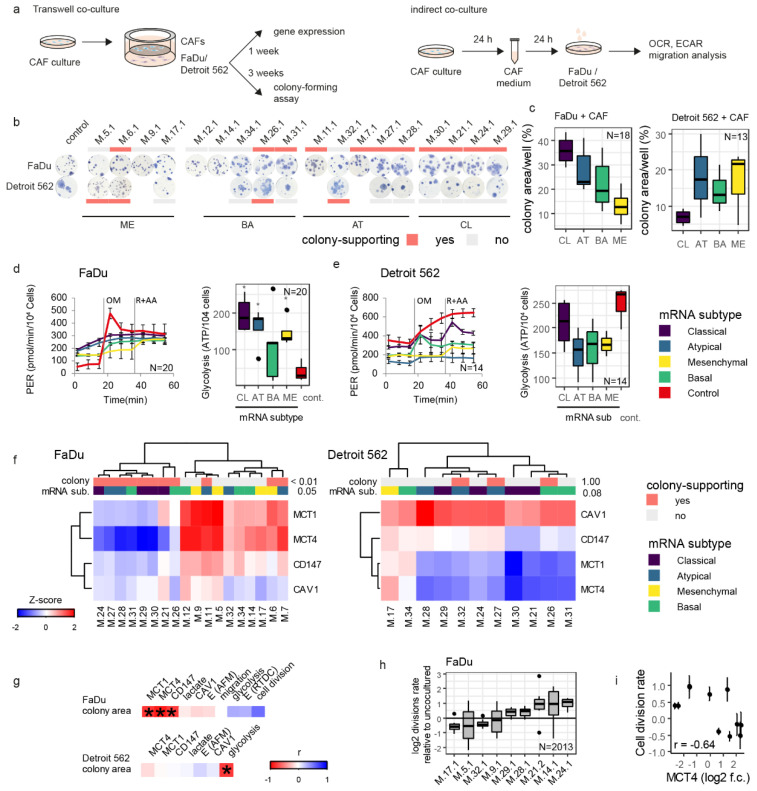
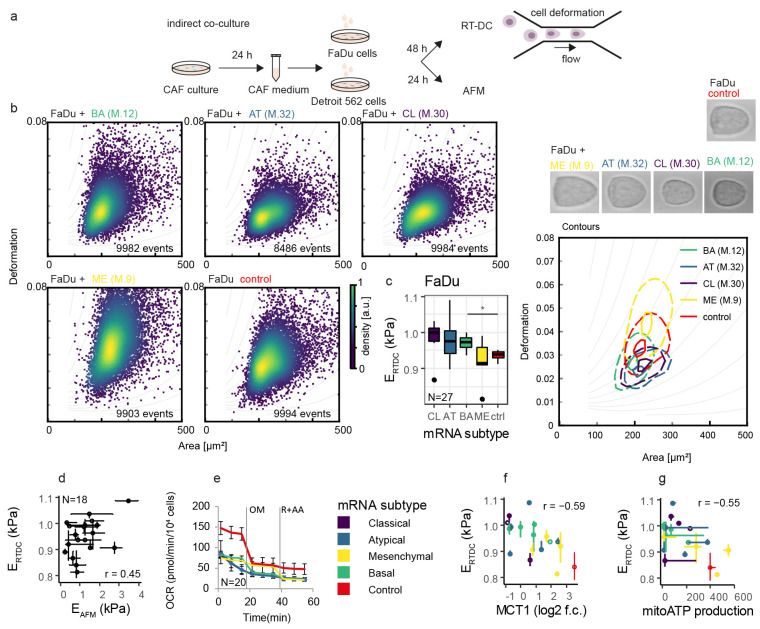
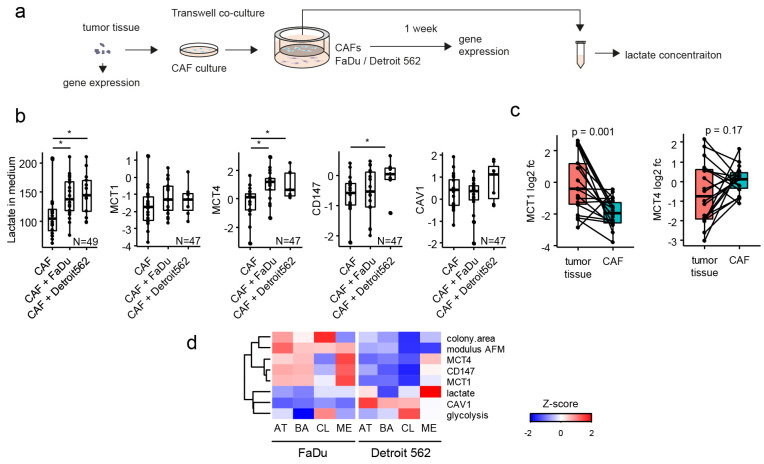
Head and neck squamous cell carcinomas (HNSCC) belong among severe and highly complex malignant diseases showing a high level of heterogeneity and consequently also a variance in therapeutic response, regardless of clinical stage. Our study implies that the progression of HNSCC may be supported by cancer-associated fibroblasts (CAFs) in the tumour microenvironment (TME) and the heterogeneity of this disease may lie in the level of cooperation between CAFs and epithelial cancer cells, as communication between CAFs and epithelial cancer cells seems to be a key factor for the sustained growth of the tumour mass. In this study, we investigated how CAFs derived from tumours of different mRNA subtypes influence the proliferation of cancer cells and their metabolic and biomechanical reprogramming. We also investigated the clinicopathological significance of the expression of these metabolism-related genes in tissue samples of HNSCC patients to identify a possible gene signature typical for HNSCC progression. We found that the right kind of cooperation between cancer cells and CAFs is needed for tumour growth and progression, and only specific mRNA subtypes can support the growth of primary cancer cells or metastases. Specifically, during coculture, cancer cell colony supporting effect and effect of CAFs on cell stiffness of cancer cells are driven by the mRNA subtype of the tumour from which the CAFs are derived. The degree of colony-forming support is reflected in cancer cell glycolysis levels and lactate shuttle-related transporters.

Keywords: HNSCC; cancer; cancer-associated fibroblasts; cell stiffness; tumour microenvironment.


Conflict of interest statement

The authors declare no conflict of interest.

Figures

Figure 1
Figure 1
Lineage specificity of cancer-associated fibroblast (CAF) culture and cancer cells. (a) schematic of stromal cell isolation from tumour tissue fragments. (b) CD90 lineage specificity of CAF culture, positivity shown for viable = SYTOX™ Blue-negative cell subpopulation (SYTOX™ Blue stains dead cells with compromised plasma membranes but will not cross intact cell membranes), for more cases see Figure S1. (c) morphology of CAFs, scalebar indicate 10 μm. (d) CD44/CD90 status of FaDu and Detroit 562 head and neck cancer cell lines. (e) mRNA subtype-relevant genes, mean expression in FaDu and Detroit 562 cancer cell lines.
Figure 2
Figure 2
Cancer cell colony-forming capacity and lactate shuttling are reprogrammed by CAFs through coculture. (a) schematic of Transwell coculture and indirect coculture with conditioned media. (b) colony-forming assay, cancer cells Transwell-cultured with CAFs; colony-supporting indicate p < 0.05 for colony size vs. non-cocultured control (see Figure S2). Measurements were performed in triplicate. (c) cancer cell colony area affected by CAFs derived from tumour tissues of varying mRNA subtypes. CL, classical, AT, atypical, BA, basal, ME, mesenchymal. CAFs derived from tumour tissues of different mRNA subtypes affect FaDu (d) and Detroit 562 (e) glycolytic ATP production differently. Performed in triplicate; PER = Proton efflux rate, rate of protons extruded into the extracellular medium during glycolysis. (f) expression of lactate-shuttle-relevant genes in cancer cell lines is associated with tumour tissue-of-origin mRNA subtype and colony-supporting status after CAF coculture. (g) correlation heatmap of the colony-forming assay with lactate-shuttle-relevant genes, lactate in medium, cells’ Young’s modulus and ATP production from glycolysis. An asterisk indicates a statistically significant correlation at p < 0.05 according to the Fischer-exact test for cluster vs. colony-supporting status and mRNA subtype. (h) Division rate of FaDu cells cocultured with CAFs relative to non-cocultured cells (0 indicates non-cocultured). N indicate the number of divisions detected in timelapse in 74 fields of view. (i) cell division rate correlates negatively with MCT4 in FaDu. OM = oligomycin; R = rotenone; AA = antimycin A; mRNA sub. = mRNA subtype; ERT-DC = Young’s modulus, real-time deformability cytometry, E (AFM) = Young’s modulus, atomic force microscopy.
Figure 3
Figure 3
Cancer cell stiffness is affected by CAF coculture. (a) schematic of indirect (conditioned media-based) coculture experimental scheme used for cancer cell mechanophenotypisation. (b) Real-time deformability cytometry (RT-DC) scatterplots show the dependence of cell deformation on cell size. One dot represents a single cell. Representative scatterplots of FaDu cells cocultured with a CAF-conditioned medium (left) and contour plots of these scatterplots with representative cells (image width 25 µm). CAFs were derived from four tumour tissue mRNA subtypes: BA, basal; AT, atypical; CL, classical; ME, mesenchymal. For all patients tested see Figure S4. (c) Young’s modulus determined by RT-DC (ERT-DC) for four major mRNA subtypes. Performed in duplicates per CAF coculture treatment, N indicates the number of cocultures, asterisk indicates statistical significance at p < 0.05. (d) Young’s modulus determined by RT-DC and atomic force microscopy weakly correlates; for AFM measurements see Figure S4. (e) The oxygen consumption rate (OCR) of FaDu cells is affected by the CAF mRNA subtype and is in negative correlation with Young’s modulus (g), and MCT1 FaDu expression (f) OM = oligomycin; R = rotenone; AA = antimycin A; ERT-DC = Young modulus, real-time deformability cytometry, EAFM=Young modulus, atomic force microscopy.
Figure 4
Figure 4
Coculture of the CAFs with cancer cell lines increases lactate in medium and lactate shuttle-relevant gene expression in CAFs. (a) scheme of measurement, (b) levels of lactate in medium and lactate-shuttle-relevant genes expression level in CAFs, asterisk indicate p < 0.05 in paired t-test. (c) MCT1 and MCT4 gene expression in tumour tissue and corresponding tumour tissue-derived CAFs. p indicates the result of paired t-test, individual dots represent individual patient-derived CAFs. (d) summary of the coculture data –shown as an integrative heatmap of measured data on cocultured cells, shown as a mean-per-mRNA subtype (CL, classical, AT, atypical, BA, basal, ME, mesenchymal).
Figure 5
Figure 5
Lactate shuttle-relevant gene expression clusters in tumour tissues are associated with patient survival. (a) heatmap of tumour tissue lactate shuttle-relevant gene expression in 55 primary head and neck tumours. p values on the right side indicate Fischer’s exact test for p16 status tissue site, node status, cancer stage, smoking, and mRNA subtype. Clustering results in two clusters, which demonstrated an overall survival trend in the Kaplan-Meier chart (b). (c) Cox regression, stepwise model. Gene expression cluster is an overall survival predictor independent of tumour node status (pN), p16 status, and tumour stage, which were used as input in the Cox model. Asterisk highlights displayed p-values lower than 0.05. (d) MCT1 and MCT4 expression in the stroma and tumorous tissues, representative basal, mesenchymal, and atypical mRNA subtype tumours. MCT1 cytoplasmic positivity and isolated membrane positivity in tumour cells, of AT tumours (first column), MCT4 weak positivity in tumour tissue and strong positivity of inflammatory elements and sparse stromal cells in peritumoral stroma (S) on a periphery of tumour nests (T, indicated by the arrow, second column); MCT1 positivity of isolated tumour cells in a basal layer of the nests, BA tumours (indicated by the arrow, third column); MCT1 negativity in tumorous tissues (last column). 40×, scalebar indicates 100 μm, detail width 80 μm. (e) MCT1/4 tumour tissue positivity and mRNA subtype in immunohistochemical staining.

Similar articles

Cited by

References

    1. Stewart B.W., Wild C.P. World Cancer Report 2014. WHO Press; Geneva, Switzerland: 2014.
    1. Peltanova B., Raudenska M., Masarik M. Effect of tumor microenvironment on pathogenesis of the head and neck squamous cell carcinoma: A systematic review. Mol. Cancer. 2019;18:63. doi: 10.1186/s12943-019-0983-5. - DOI - PMC - PubMed
    1. Ansems M., Span P.N. The tumor microenvironment and radiotherapy response; a central role for cancer-associated fibroblasts. Clin. Transl. Radiat. Oncol. 2020;22:90–97. doi: 10.1016/j.ctro.2020.04.001. - DOI - PMC - PubMed
    1. Gouirand V., Guillaumond F., Vasseur S. Influence of the Tumor Microenvironment on Cancer Cells Metabolic Reprogramming. Front. Oncol. 2018;8:117. doi: 10.3389/fonc.2018.00117. - DOI - PMC - PubMed
    1. Kumar D., New J., Vishwakarma V., Joshi R., Enders J., Lin F., Dasari S., Gutierrez W.R., Leef G., Ponnurangam S., et al. Cancer-Associated Fibroblasts Drive Glycolysis in a Targetable Signaling Loop Implicated in Head and Neck Squamous Cell Carcinoma Progression. Cancer Res. 2018;78:3769–3782. doi: 10.1158/0008-5472.CAN-17-1076. - DOI - PMC - PubMed

LinkOut - more resources