

MEOX2 Regulates the Growth and Survival of Glioblastoma Stem Cells by Modulating Genes of the Glycolytic Pathway and Response to Hypoxia
- PMID: 35565433
- PMCID: PMC9099809
- DOI: 10.3390/cancers14092304
MEOX2 Regulates the Growth and Survival of Glioblastoma Stem Cells by Modulating Genes of the Glycolytic Pathway and Response to Hypoxia
Abstract
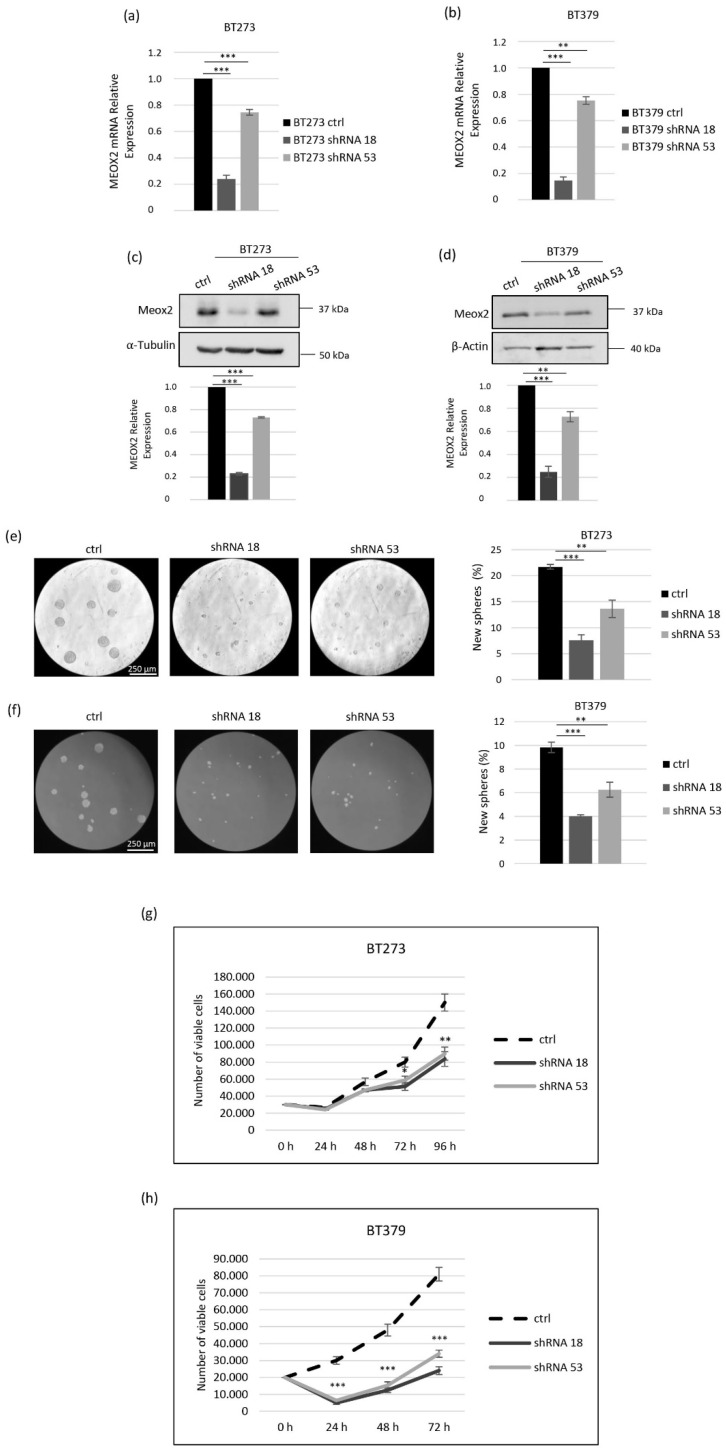
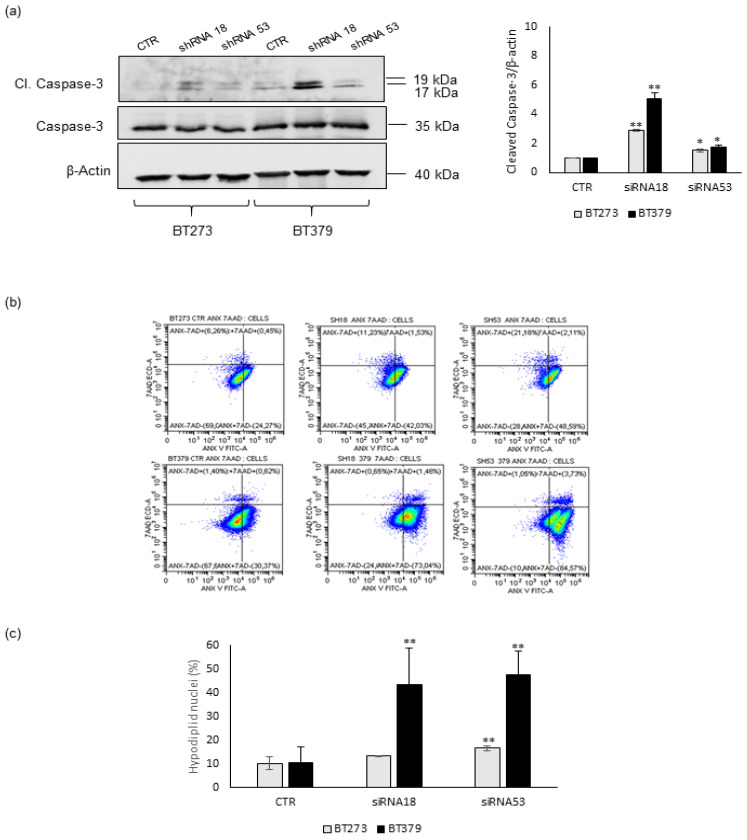
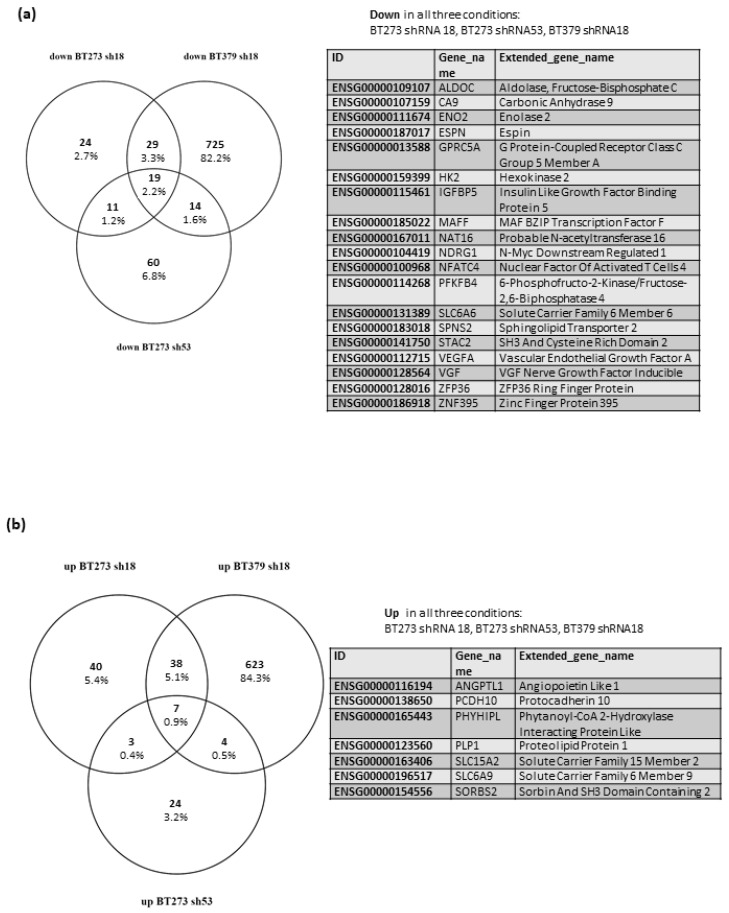
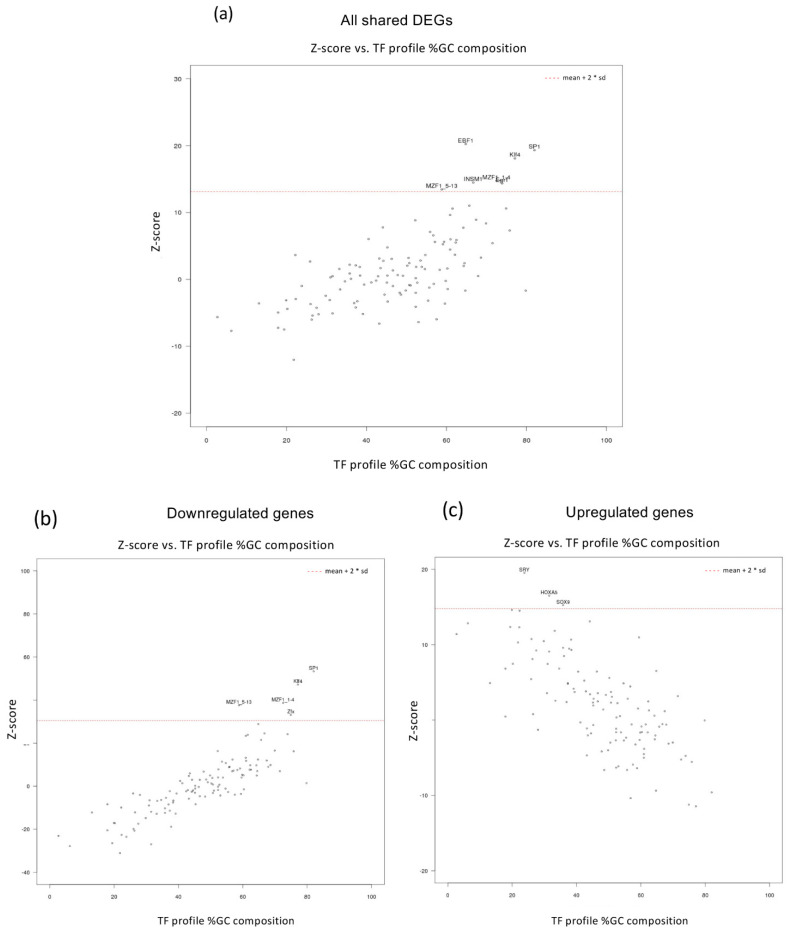
The most widely accepted hypothesis for the development of glioblastoma suggests that glioblastoma stem-like cells (GSCs) are crucially involved in tumor initiation and recurrence as well as in the occurrence of chemo- and radio-resistance. Mesenchyme homeobox 2 (MEOX2) is a transcription factor overexpressed in glioblastoma, whose expression is negatively correlated with patient survival. Starting from our observation that MEOX2 expression is strongly enhanced in six GSC lines, we performed shRNA-mediated knock-down experiments in two different GSC lines and found that MEOX2 depletion resulted in the inhibition of cell growth and sphere-forming ability and an increase in apoptotic cell death. By a deep transcriptome analysis, we identified a core group of genes modulated in response to MEOX2 knock-down. Among these genes, the repressed ones are largely enriched in genes involved in the hypoxic response and glycolytic pathway, two strictly related pathways that contribute to the resistance of high-grade gliomas to therapies. An in silico study of the regulatory regions of genes differentially expressed by MEOX2 knock-down revealed that they mainly consisted of GC-rich regions enriched for Sp1 and Klf4 binding motifs, two main regulators of metabolism in glioblastoma. Our results show, for the first time, the involvement of MEOX2 in the regulation of genes of GSC metabolism, which is essential for the survival and growth of these cells.
Keywords: MEOX2; glioblastoma stem cells; glycolytic enzymes; sphere formation.
Conflict of interest statement
The funders had no role in the design of the study; in the collection, analyses, or interpretation of data; in the writing of the manuscript, or in the decision to publish the results.
Figures
Similar articles
-
MEOX2 Transcription Factor Is Involved in Survival and Adhesion of Glioma Stem-like Cells.Cancers (Basel). 2021 Nov 25;13(23):5943. doi: 10.3390/cancers13235943. Cancers (Basel). 2021. PMID: 34885053 Free PMC article.
-
MEOX2 homeobox gene promotes growth of malignant gliomas.Neuro Oncol. 2022 Nov 2;24(11):1911-1924. doi: 10.1093/neuonc/noac110. Neuro Oncol. 2022. PMID: 35468210 Free PMC article.
-
Molecular mechanisms underlying gliomas and glioblastoma pathogenesis revealed by bioinformatics analysis of microarray data.Med Oncol. 2017 Sep 26;34(11):182. doi: 10.1007/s12032-017-1043-x. Med Oncol. 2017. PMID: 28952134
-
Stem cell signature in glioblastoma: therapeutic development for a moving target.J Neurosurg. 2015 Feb;122(2):324-30. doi: 10.3171/2014.9.JNS132253. Epub 2014 Nov 14. J Neurosurg. 2015. PMID: 25397368 Review.
-
The hypoxic peri-arteriolar glioma stem cell niche, an integrated concept of five types of niches in human glioblastoma.Biochim Biophys Acta Rev Cancer. 2018 Apr;1869(2):346-354. doi: 10.1016/j.bbcan.2018.04.008. Epub 2018 Apr 21. Biochim Biophys Acta Rev Cancer. 2018. PMID: 29684521 Review.
Cited by
-
Inhibition of the Phospholipase Cε-c-Jun N-Terminal Kinase Axis Suppresses Glioma Stem Cell Properties.Int J Mol Sci. 2022 Aug 7;23(15):8785. doi: 10.3390/ijms23158785. Int J Mol Sci. 2022. PMID: 35955917 Free PMC article.
-
SIM2, associated with clinicopathologic features, promotes the malignant biological behaviors of endometrial carcinoma cells.BMC Cancer. 2025 Apr 11;25(1):666. doi: 10.1186/s12885-025-14077-0. BMC Cancer. 2025. PMID: 40217155 Free PMC article.
References
-
- Louis D.N., Perry A., Wesseling P., Brat D.J., Cree I.A., Figarella-Branger D., Hawkins C., Ng H.K., Pfister S.M., Reifenberger G., et al. The 2021 WHO Classification of Tumors of the Central Nervous System: A summary. Neuro Oncol. 2021;23:1231–1251. doi: 10.1093/neuonc/noab106. - DOI - PMC - PubMed
-
- Fernandes C., Costa A., Osório L., Lago R.C., Linhares P., Carvalho B., Caeiro C. Current Standards of Care in Glioblastoma Therapy. In: De Vleeschouwer S., editor. Glioblastoma. Codon Publications; Brisbane, Australia: 2017. Chapter 11. - PubMed
-
- Stupp R., Taillibert S., Kanner A., Read W., Steinberg D., Lhermitte B., Toms S., Idbaih A., Ahluwalia M.S., Fink K., et al. Effect of Tumor-Treating Fields Plus Maintenance Temozolomide vs. Maintenance Temozolomide Alone on Survival in Patients With Glioblastoma: A Randomized Clinical Trial. JAMA. 2017;318:2306–2316. doi: 10.1001/jama.2017.18718. Erratum in JAMA 2018, 319, 1824. - DOI - PMC - PubMed
-
- Verhaak R.G., Hoadley K.A., Purdom E., Wang V., Qi Y., Wilkerson M.D., Miller C.R., Ding L., Golub T., Mesirov J.P., et al. Cancer Genome Atlas Research Network. Integrated genomic analysis identifies clinically relevant subtypes of glioblastoma characterized by abnormalities in PDGFRA, IDH1, EGFR, and NF1. Cancer Cell. 2010;17:98–110. doi: 10.1016/j.ccr.2009.12.020. - DOI - PMC - PubMed
-
- Wang Q., Hu B., Hu X., Kim H., Squatrito M., Scarpace L., de Carvalho A.C., Lyu S., Li P., Li Y., et al. Tumor Evolution of Glioma-Intrinsic Gene Expression Subtypes Associates with Immunological Changes in the Microenvironment. Cancer Cell. 2017;32:42–56.e6. doi: 10.1016/j.ccell.2017.06.003. - DOI - PMC - PubMed
Grants and funding
LinkOut - more resources
Full Text Sources
Molecular Biology Databases
Research Materials
Miscellaneous
