Review
. 2022 May 7;14(9):2322.
doi: 10.3390/cancers14092322.

Muscarinic Receptors Associated with Cancer

Affiliations
Review

Muscarinic Receptors Associated with Cancer

Gloria M Calaf et al. Cancers (Basel). .

Abstract

Cancer has been considered the pathology of the century and factors such as the environment may play an important etiological role. The ability of muscarinic agonists to stimulate growth and muscarinic receptor antagonists to inhibit tumor growth has been demonstrated for breast, melanoma, lung, gastric, colon, pancreatic, ovarian, prostate, and brain cancer. This work aimed to study the correlation between epidermal growth factor receptors and cholinergic muscarinic receptors, the survival differences adjusted by the stage clinical factor, and the association between gene expression and immune infiltration level in breast, lung, stomach, colon, liver, prostate, and glioblastoma human cancers. Thus, targeting cholinergic muscarinic receptors appears to be an attractive therapeutic alternative due to the complex signaling pathways involved.

Keywords: breast; cancer; colorectal; gastric; glioblastoma; liver; lung; muscarinic receptors; prostate.


Conflict of interest statement

The authors declare no conflict of interest. The funders had no role in the design of the study; in the collection, analyses, or interpretation of data; in the writing of the manuscript, or in the decision to publish the results.

Figures
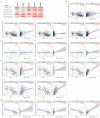
Figure 1
Figure 1
The co-expression pattern of genes across various cancer types was evaluated with the Timer2.0 Exploration component. (A) The heatmap table, from the Gene Corr Module, shows the correlation between EGFR expression and cholinergic muscarinic receptor 1–5 (CHRM1–5) in all breast invasive carcinoma (BRCA), BRCA-Basal, BRCA-Her2, BRCA-LumA, and BRCA-LumB with purity adjustment. The red color indicates a statistically significant positive correlation (Spearman’s, p < 0.05), and gray denotes a non-significant result. Scatter plots show significant correlations between EGFR expression and (B) (a) CHRM1, (b) CHRM3, (c) CHRM4, and (d) CHRM5 in all BRCA (n = 1100); (C) (a) CHRM3, (b) CHRM4, and (c) CHRM5 in BRCA-Basal (n = 191); (D) (a) CHRM1, (b) CHRM2, (c) CHRM3, (d) CHRM4, and (e) CHRM5 in BRCA-LumA, and (E) (a) CHRM2, (b) CHRM4, and (c) CHRM5 in BRCA-LumB with tumor purity (left panel) and with the expression level estimated by TIMER2.0 (right panel) [11].
Figure 2
Figure 2
Associations between gene expression and tumor features in TCGA were evaluated with the exploration component of the Timer2.0 web resource. (A) The heatmap table generated by the Gene Outcome Module shows the survival analysis of cholinergic receptor muscarinic 1–5 (CHRM15) and EGFR expression in breast invasive carcinoma (all BRCA), BRCA-Basal, BRCA-Her2, BRCA-LumA, and BRCA-LumB adjusted by the clinical-stage factor. The red color indicates a statistically significant increased risk (Z-score, p < 0.05), the blue color indicates a significantly decreased risk (Z-score, p < 0.05), and gray denotes a nonsignificant result. The Kaplan–Meier (KM) curves provide detailed information about the corresponding significant relationship between gene expression and survival of (B) CHRM4 in BRCA-Basal (n = 191), (C) CHRM4 in BRCA-Her2 (n = 82), and (D) CHRM3 in BRCA-LumA (n = 568) at low and high expression given by cumulative survival and time to follow-up estimated by TIMER2.0 [11].
Figure 3
Figure 3
Association between immune infiltrates and gene expression evaluated with TIMER2.0 web resource. (A) The heatmap table, an output from the Gene Module, shows the association between EFGR, cholinergic muscarinic receptor expression 1–5 (CHRM15), and immune infiltration level of T cell CD8+ across breast invasive carcinomas (BRCA). The red color indicates a statistically significant positive correlation (Spearman’s, p < 0.05) and gray denotes a nonsignificant result. Scatter plots show the correlation between (B) EGFR expression and T cell CD8+ in (a) all BRCA (n = 1100), (b) BRCA-Basal (n = 191), (c) BRCA-LumA (n = 568), and (d) BRCA-LumB (n = 219); (C) CHRM2 and T cell CD8+ in BRCA-Her2 (n = 82); (D) CHRM3 and T cell CD8+ in BRCA-LumA; (E) CHRM4 and T cell CD8+ in (a) all BRCA, (b) BRCA-Her2, (c) BRCA-LumA, and (d) BRCA-LumB; and (F) CHRM5 and T cell CD8+ in (a) all BRCA and (b) BRCA-LumA with tumor purity (left panel) and with the infiltration level of T cell CD8+ estimated by TIMER2.0 (right panel) [11].
Figure 4
Figure 4
Co-expression pattern of genes across various cancer types explored with TIMER2.0. (A) The heatmap table, an output from the Gene Corr Module, shows the correlation between EGFR expression and cholinergic receptor muscarinic 1–5 (CHRM1–5) in lung adenocarcinoma (LUAD) and lung squamous cell carcinoma (LUSC) with purity adjustment. The red color indicates a statistically significant positive correlation (Spearman’s, p < 0.05) and gray denotes a non-significant result. Scatter plots show the significant correlations between EGFR expression and (B) (a) CHRM3, (b) CHRM4, and (c) CHRM5 in LUAD (n = 515); and (C) (a) CHRM3, (b) CHRM4, and (c) CHRM5 in LUSC (n = 501) with tumor purity (left panel) and with the expression level estimated by TIMER2.0 (right panel) [11].
Figure 5
Figure 5
Associations between gene expression and tumor features in TCGA were evaluated with the Timer2.0 Exploration component. (A) The heatmap table generated by the Gene Outcome Module shows the survival analysis of cholinergic receptor muscarinic 1–5 (CHRM15) and EGFR expression in lung adenocarcinoma (LUAD) and lung squamous cell carcinoma (LUSC) adjusted by the clinical-stage factor. The red color indicates a statistically significant increased risk (Z-score, p < 0.05) and gray denotes a nonsignificant result. The Kaplan–Meier (KM) curves provide detailed information about the corresponding significant relationship between gene expression and survival of (B) CHRM2 in LUSC (n = 501) at low and high expression given by cumulative survival and time to follow-up [11].
Figure 6
Figure 6
TIMER2.0 Immune component was used to evaluate associations between immune infiltrates and gene expression. (A) The heatmap table, an output of the Gene Module, shows the association between EFGR, cholinergic muscarinic receptor expression 1-3 (CHRM1-3), and immune infiltration level of T cell CD8+ across lung adenocarcinoma (LUAD) and lung squamous cell carcinoma (LUSC). The red color indicates a statistically significant positive correlation (Spearman’s, p < 0.05) and gray denotes a nonsignificant result. Scatter plots show the correlation between (B) EGFR expression and T cell CD8+ in LUAD (n = 515); (C) CHRM2 expression and T cell CD8+ in LUAD; and (D) CHRM4 expression and T cell CD8+ in (a) LUAD and (b) LUSC (n = 501) with tumor purity (left panel) and with the infiltration level of T cell CD8+ estimated by TIMER2.0 (right panel) [11].
Figure 7
Figure 7
Co-expression pattern of genes across stomach adenocarcinoma (STAD) explored with TIMER2.0. (A) The heatmap table, an output from the Gene Corr Module, shows the correlation between EGFR expression and cholinergic receptor, muscarinic 1–5 (CHRM15) in STAD with purity adjustment. The red color indicates a statistically significant positive correlation (Spearman’s, p < 0.05), blue indicates a statistically significant negative correlation (Spearman’s, p < 0.05). Scatter plots show significant correlations between EGFR expression and (B) (a) CHRM1, (b) CHRM2, (c) CHRM3, (d) CHRM4, and (e) CHRM5 in STAD (n = 415) with tumor purity (left panel) and with the expression level estimated by TIMER2.0 (right panel) [11].
Figure 8
Figure 8
Associations between gene expression and tumor features in TCGA were evaluated with the Timer2.0 Exploration component. (A) The heatmap table generated by the Gene Outcome Module shows the survival analysis of cholinergic receptor muscarinic 1–5 (CHRM15) and EGFR expression in stomach adenocarcinoma (STAD) adjusted by the clinical-stage factor. The red color indicates a statistically significant increased risk (Z-score, p < 0.05) and gray denotes a nonsignificant result. The Kaplan–Meier (KM) curves provide detailed information about the corresponding significant relationship between gene expression and survival of (B) CHRM2 and (C) EGFR in STAD (n = 415) at low and high expression given by cumulative survival and time to follow-up [11].
Figure 9
Figure 9
TIMER2.0 Immune component was used to evaluate associations between gene expression and immune infiltrates. (A) The heatmap table shows the association between EFGR, cholinergic muscarinic receptor expression 1–5 (CHRM15), and immune infiltration level of T cell CD8+ in stomach adenocarcinoma (STAD). The red color indicates a statistically significant positive correlation (Spearman’s, p < 0.05), blue indicates a statistically significant negative correlation (Spearman’s, p < 0.05), and gray denotes a nonsignificant result. Scatter plots show the correlation between (B) CHRM1, (C) CHRM2, and (D) CHRM4 expressions and T cell CD8+ in STAD (n = 415) with tumor purity (left panel) and with the infiltration level of T cell CD8+ estimated by TIMER2.0 (right panel) [11].
Figure 10
Figure 10
Co-expression pattern of genes across colon adenocarcinoma (COAD) evaluated by Timer2.0 Exploration components. (A) The heatmap table, an output from the Gene Corr Module, shows the correlation between EGFR expression and cholinergic receptor muscarinic 1–5 (CHRM15) in COAD with purity adjustment. The red color indicates a statistically significant positive correlation (Spearman’s, p < 0.05) and gray denotes a nonsignificant result. Scatter plots show the correlation between EGFR expression and (B) (a) CHRM2, (b) CHRM4, and (c) CHRM5 in COAD (n = 458) with tumor purity (left panel) and with the expression level estimated by TIMER2.0 (right panel) [11].
Figure 11
Figure 11
TIMER2.0 Immune component was used to evaluate associations between immune infiltrates and gene expression. (A) Heatmap table shows the association between EFGR, cholinergic muscarinic receptor expression 1–5 (CHRM15), and immune infiltration level of T cell CD8+ in colon adenocarcinoma (STAD). The red color indicates a statistically significant positive correlation (Spearman’s, p < 0.05) and gray denotes a nonsignificant result. Scatter plots show the correlation between (B) EGFR and (C) CHRM4 expressions in COAD (n = 458) with tumor purity (left panel) and with the infiltration level of T cell CD8+ estimated by TIMER2.0 (right panel) [11].
Figure 12
Figure 12
Co-expression pattern of genes in liver hepatocellular carcinoma (LIHC) explored with TIMER2.0. (A) The heatmap table, an output of the Gene Corr Module, shows the correlation between EGFR expression and cholinergic receptor muscarinic 1–5 (CHRM15) in LIHC with purity adjustment. The red color indicates a statistically significant positive correlation (Spearman’s, p < 0.05) and gray denotes a nonsignificant result. Scatter plots show the significant correlations between EGFR expression and (B) (a) CHRM2, (b) CHRM3, (c) CHRM4, and (d) CHRM5 in LIHC (n = 371) with tumor purity (left panel) and with the expression level estimated by TIMER2.0 (right panel) [11].
Figure 13
Figure 13
Associations between immune infiltrate and gene expression evaluated with TIMER2.0 Immune component. (A) The heatmap table shows the association between EGFR, cholinergic muscarinic receptor expression 1–5 (CHRM15), and immune infiltration level of T cell CD8+ in liver hepatocellular carcinoma (LIHC). The red color indicates a statistically significant positive correlation (Spearman’s, p < 0.05) and gray denotes a nonsignificant result. Scatter plots show the correlation between (B) EGFR, (C) CHRM2, (D) CHRM3, (E) CHRM4 expression, and T cell CD8+ in LIHC (n = 371) with tumor purity (left panel) and with the infiltration level of T cell CD8+ estimated by TIMER2.0 (right panel) [11].
Figure 14
Figure 14
Co-expression pattern of genes across prostate adenocarcinoma (PRAD) explored with TIMER2.0. (A) The heatmap table, an output from the Gene Corr Module, shows the correlation between EGFR expression and cholinergic receptor, muscarinic 1–5 (CHRM15) in PRAD with purity adjustment. The red color indicates a statistically significant positive correlation (Spearman’s, p < 0.05). Scatter plots show significant correlations between EGFR expression and (B) (a) CHRM1, (b) CHRM2, (c) CHRM3, (d) CHRM4, and (e) CHRM5 in PRAD (n = 498) with tumor purity (left panel) and with the expression level estimated by TIMER2.0 (right panel) [11].
Figure 15
Figure 15
Associations between immune infiltrate and gene expression were evaluated with the TIMER2.0 Immune component. (A) Heatmap table shows the association between EGFR, cholinergic muscarinic receptor expression 1–5 (CHRM15), and immune infiltration level of T cell CD8+ in prostate adenocarcinoma (PRAD). The red color indicates a statistically significant positive correlation (Spearman’s, p < 0.05) and gray denotes a nonsignificant result. Scatter plots show the correlation between (B) EGFR, (C) CHRM1, (D) CHRM2, (E) CHRM3, (F) CHRM4 expression and T cell CD8+ in PRAD (n = 498) with tumor purity (left panel) and with the infiltration level of T cell CD8+ estimated by TIMER2.0 (right panel) [11].
Scheme 1
Scheme 1
Correlation between EGFR and cholinergic muscarinic receptors 1–5 in breast, lung, stomach, colon, liver, prostate, and glioblastoma human cancers.

References

    1. Linet M.S. Evolution of cancer epidemiology. Epidemiol. Rev. 2000;22:35–56. doi: 10.1093/oxfordjournals.epirev.a018023. - DOI - PubMed
    1. Greenwald P., Dunn B.K. Landmarks in the history of cancer epidemiology. Cancer Res. 2009;69:2151–2162. doi: 10.1158/0008-5472.CAN-09-0416. - DOI - PubMed
    1. Falzone L., Salomone S., Libra M. Evolution of Cancer Pharmacological Treatments at the Turn of the Third Millennium. Front. Pharmacol. 2018;9:1300. doi: 10.3389/fphar.2018.01300. - DOI - PMC - PubMed
    1. International Agency for Research on Cancer; Lyon, France: 2020. p. 596.
    1. Gittelman M. The revolution re-visited: Clinical and genetics research paradigms and the productivity paradox in drug discovery. Res. Policy. 2016;45:1570–1585. doi: 10.1016/j.respol.2016.01.007. - DOI

LinkOut - more resources