

A Data Science Approach for the Identification of Molecular Signatures of Aggressive Cancers
- PMID: 35565454
- PMCID: PMC9103663
- DOI: 10.3390/cancers14092325
A Data Science Approach for the Identification of Molecular Signatures of Aggressive Cancers
Abstract
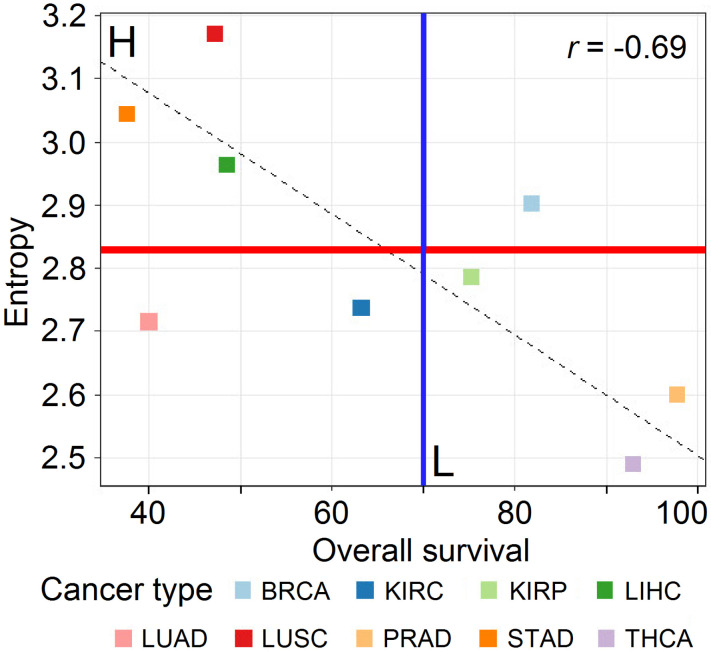
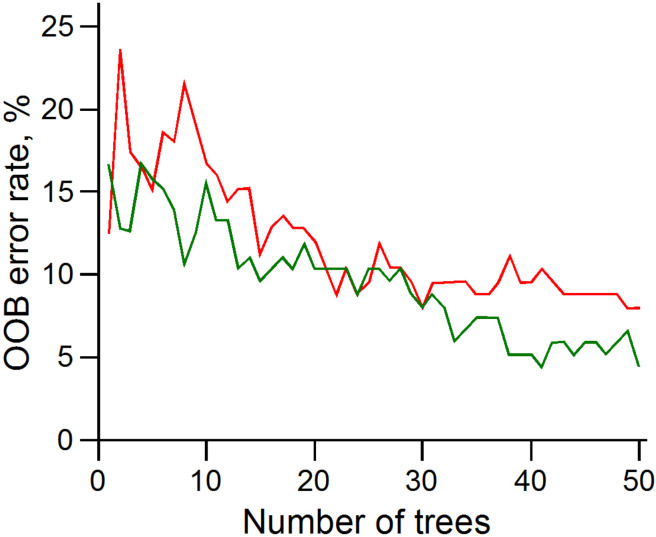
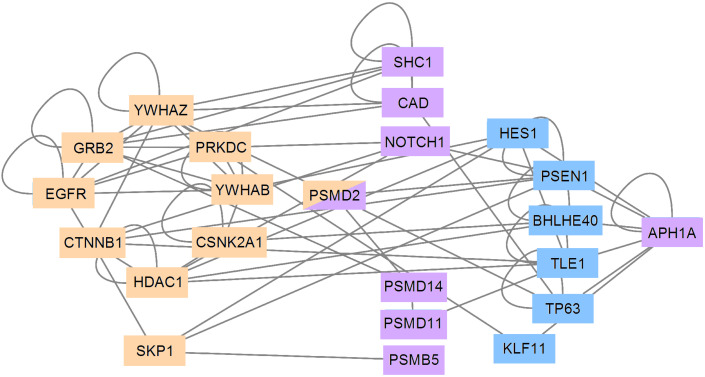
The main hallmarks of cancer include sustaining proliferative signaling and resisting cell death. We analyzed the genes of the WNT pathway and seven cross-linked pathways that may explain the differences in aggressiveness among cancer types. We divided six cancer types (liver, lung, stomach, kidney, prostate, and thyroid) into classes of high (H) and low (L) aggressiveness considering the TCGA data, and their correlations between Shannon entropy and 5-year overall survival (OS). Then, we used principal component analysis (PCA), a random forest classifier (RFC), and protein-protein interactions (PPI) to find the genes that correlated with aggressiveness. Using PCA, we found GRB2, CTNNB1, SKP1, CSNK2A1, PRKDC, HDAC1, YWHAZ, YWHAB, and PSMD2. Except for PSMD2, the RFC analysis showed a different list, which was CAD, PSMD14, APH1A, PSMD2, SHC1, TMEFF2, PSMD11, H2AFZ, PSMB5, and NOTCH1. Both methods use different algorithmic approaches and have different purposes, which explains the discrepancy between the two gene lists. The key genes of aggressiveness found by PCA were those that maximized the separation of H and L classes according to its third component, which represented 19% of the total variance. By contrast, RFC classified whether the RNA-seq of a tumor sample was of the H or L type. Interestingly, PPIs showed that the genes of PCA and RFC lists were connected neighbors in the PPI signaling network of WNT and cross-linked pathways.
Keywords: PCA; RFC; RNA-seq; WNT pathways; aggressiveness; cancer; interactome; machine learning; prognostic genes.
Conflict of interest statement
The authors declare no conflict of interest.
Figures
Similar articles
-
Machine learning assisted analysis of breast cancer gene expression profiles reveals novel potential prognostic biomarkers for triple-negative breast cancer.Comput Struct Biotechnol J. 2022 Mar 24;20:1618-1631. doi: 10.1016/j.csbj.2022.03.019. eCollection 2022. Comput Struct Biotechnol J. 2022. PMID: 35465161 Free PMC article.
-
Signaling Complexity Measured by Shannon Entropy and Its Application in Personalized Medicine.Front Genet. 2019 Oct 21;10:930. doi: 10.3389/fgene.2019.00930. eCollection 2019. Front Genet. 2019. PMID: 31695721 Free PMC article.
-
Endocrine Disrupting Chemicals Influence Hub Genes Associated with Aggressive Prostate Cancer.Int J Mol Sci. 2023 Feb 6;24(4):3191. doi: 10.3390/ijms24043191. Int J Mol Sci. 2023. PMID: 36834602 Free PMC article.
-
Machine learning and deep learning methods that use omics data for metastasis prediction.Comput Struct Biotechnol J. 2021 Sep 4;19:5008-5018. doi: 10.1016/j.csbj.2021.09.001. eCollection 2021. Comput Struct Biotechnol J. 2021. PMID: 34589181 Free PMC article. Review.
-
SRC: marker or actor in prostate cancer aggressiveness.Front Oncol. 2014 Aug 18;4:222. doi: 10.3389/fonc.2014.00222. eCollection 2014. Front Oncol. 2014. PMID: 25184116 Free PMC article. Review.
Cited by
-
A Strategy Utilizing Protein-Protein Interaction Hubs for the Treatment of Cancer Diseases.Int J Mol Sci. 2023 Nov 8;24(22):16098. doi: 10.3390/ijms242216098. Int J Mol Sci. 2023. PMID: 38003288 Free PMC article. Review.
-
Assessing RNA-Seq Workflow Methodologies Using Shannon Entropy.Biology (Basel). 2024 Jun 28;13(7):482. doi: 10.3390/biology13070482. Biology (Basel). 2024. PMID: 39056677 Free PMC article.
References
-
- Carels N., Conforte A.J., Lima C.R., da Silva F.A.B. Challenges for the optimization of drug therapy in the treatment of cancer. In: Da Silva F.A.B., Carels N., dos Santos T.M., Lopes F.J.P., editors. Computational Biology. Springer International Publishing; Cham, Switzerland: 2020. pp. 163–198.
-
- Lahiri C., Pawar S., Rohit Mishra R. Precision medicine and future of cancer treatment. Precis. Cancer Med. 2019;2:5167. doi: 10.21037/pcm.2019.09.01. - DOI
Grants and funding
LinkOut - more resources
Full Text Sources
Research Materials
Miscellaneous
