. 2022 May 9;14(9):2337.
doi: 10.3390/cancers14092337.

Impact of Secretion-Active Osteoblast-Specific Factor 2 in Promoting Progression and Metastasis of Head and Neck Cancer

Affiliations

Impact of Secretion-Active Osteoblast-Specific Factor 2 in Promoting Progression and Metastasis of Head and Neck Cancer

Désirée Gül et al. Cancers (Basel). .

Abstract

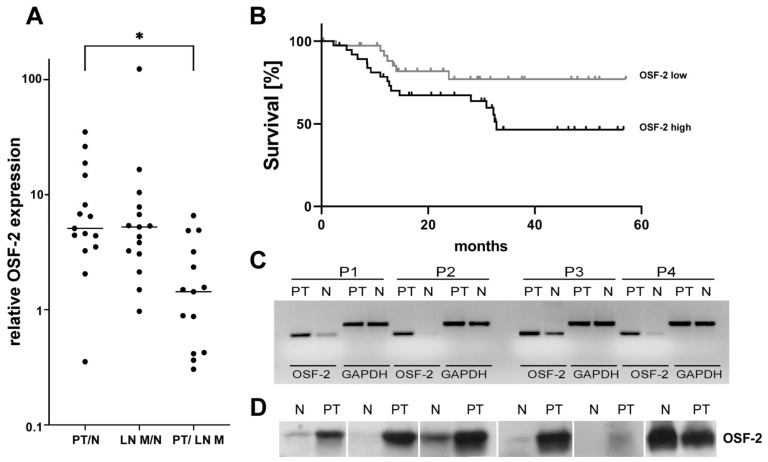
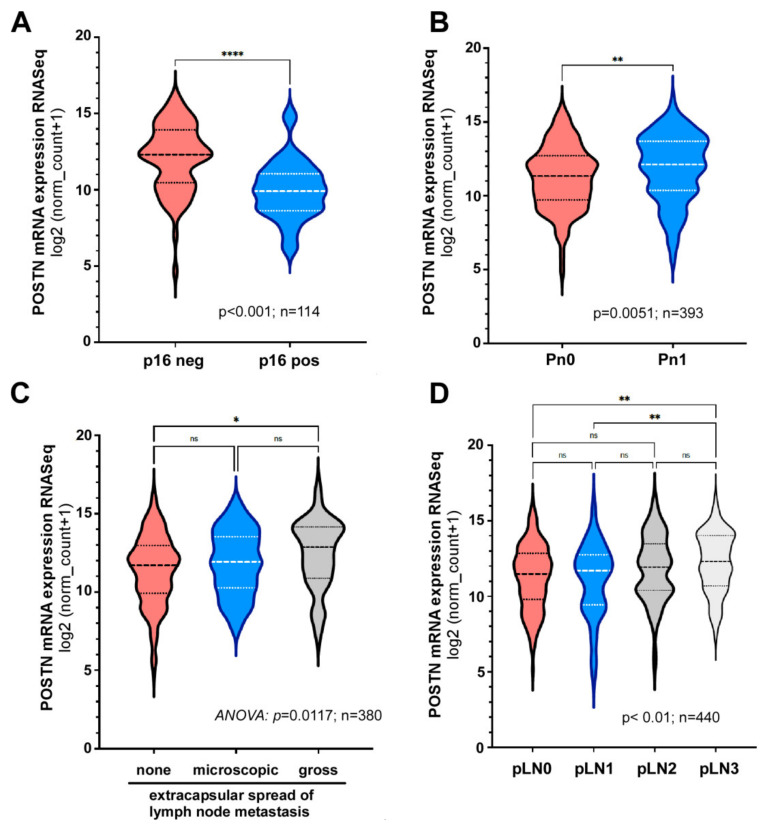
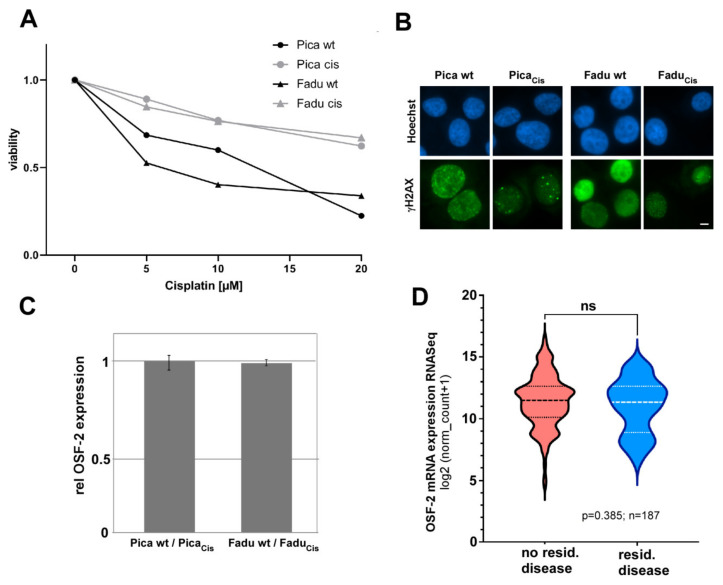
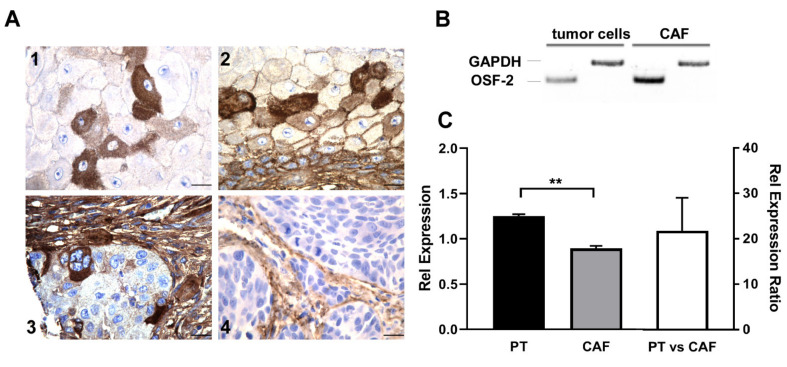
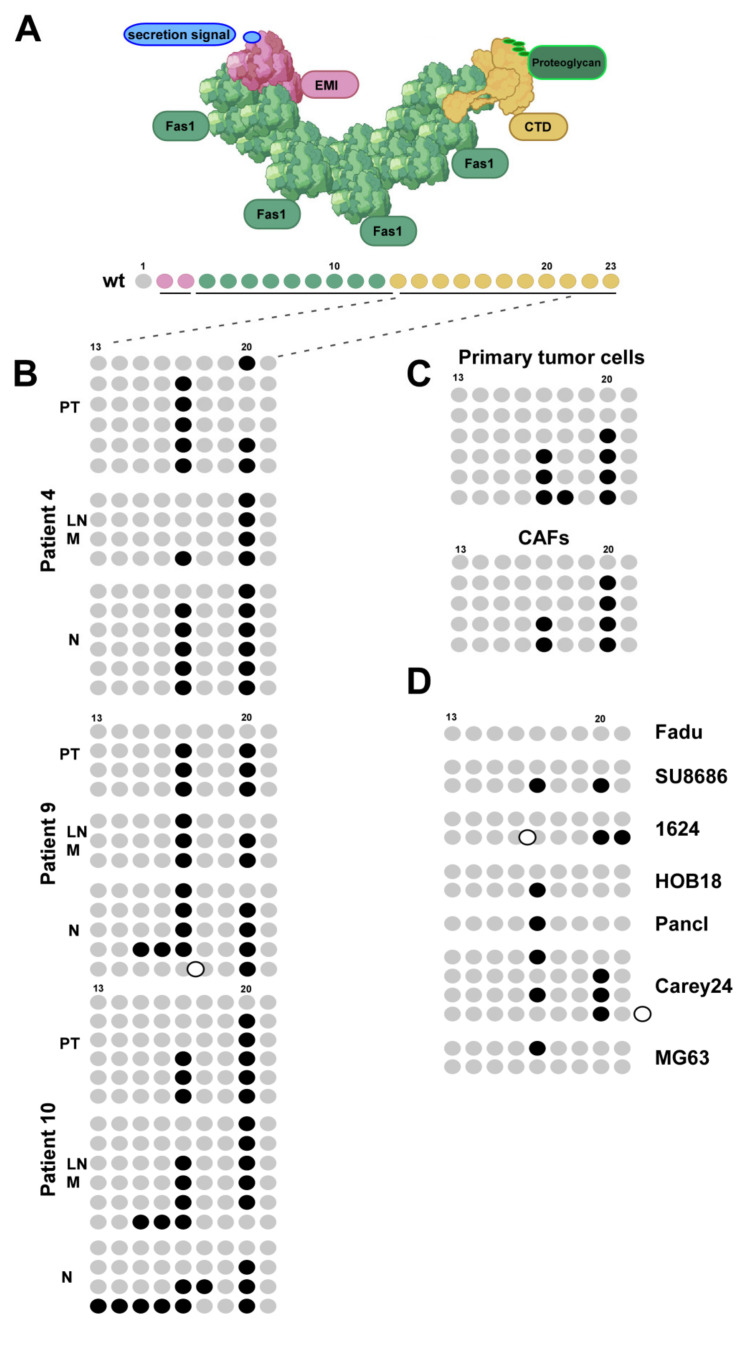
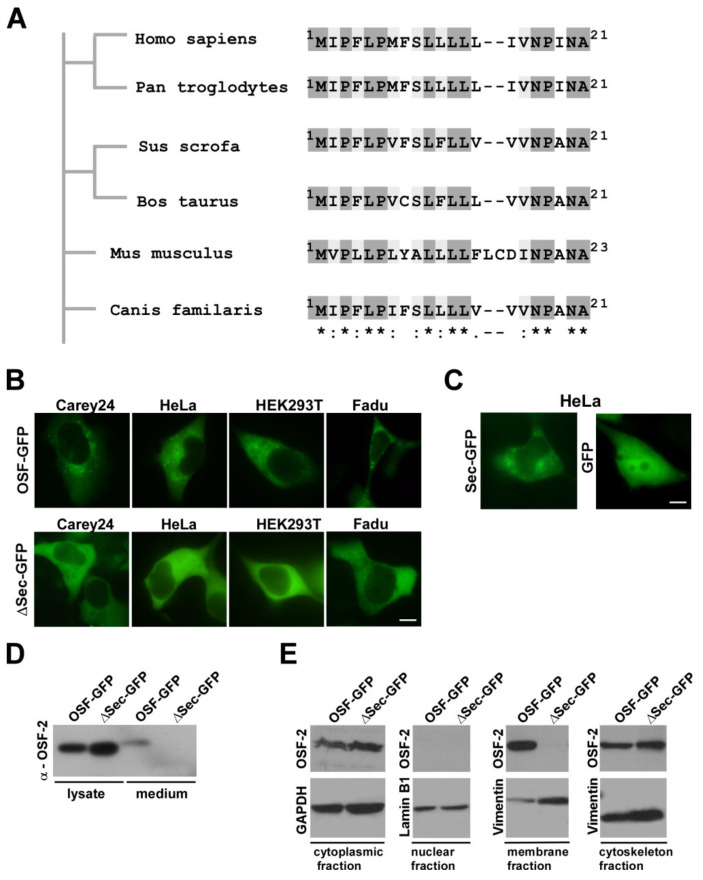
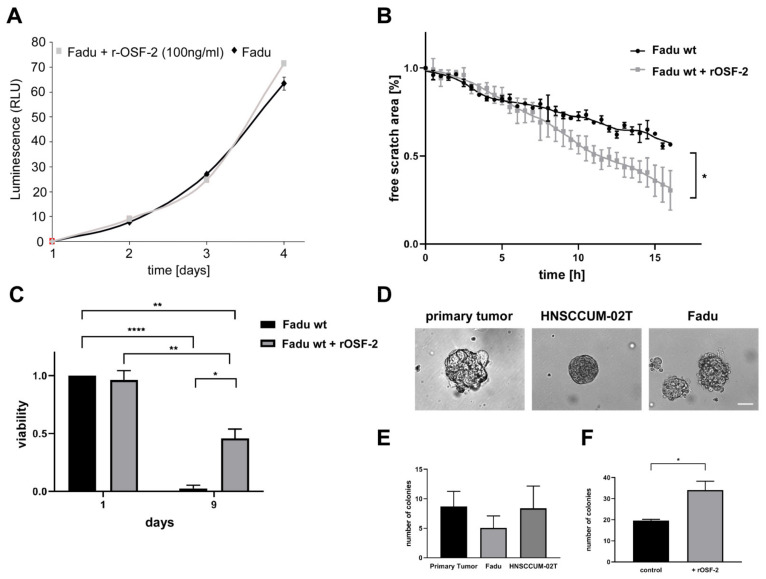
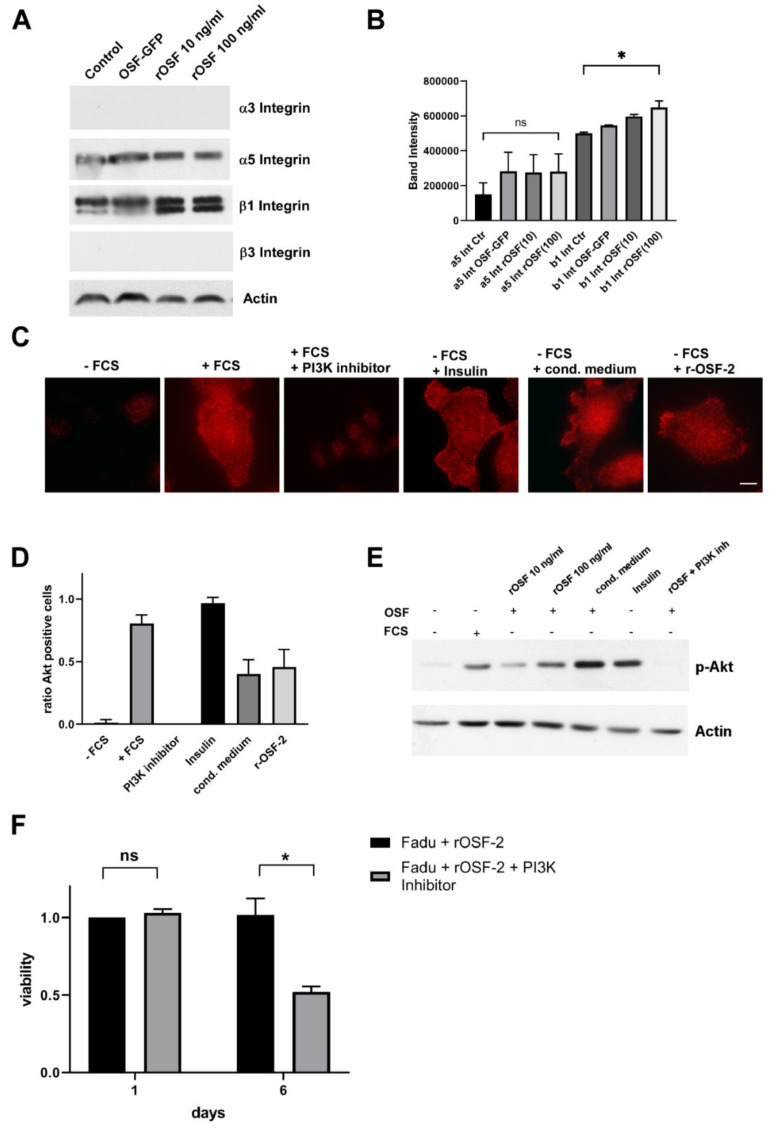
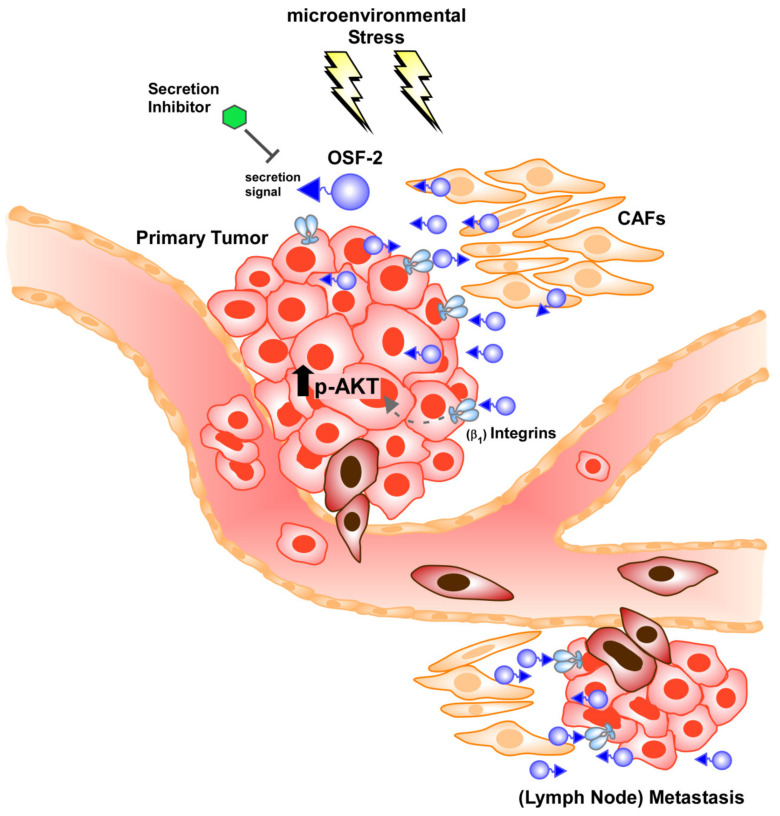
Treatment success of head and neck cancer (HNC) is still hampered by tumor relapse due to metastases. Our study aimed to identify biomarkers by exploiting transcriptomics profiles of patient-matched metastases, primary tumors, and normal tissue mucosa as well as the TCGA HNC cohort data sets. Analyses identified osteoblast-specific factor 2 (OSF-2) as significantly overexpressed in lymph node metastases and primary tumors compared to normal tissue. High OSF-2 levels correlate with metastatic disease and reduced overall survival of predominantly HPV-negative HNC patients. No significant correlation was observed with tumor localization or therapy response. These findings were supported by the fact that OSF-2 expression was not elevated in cisplatin-resistant HNC cell lines. OSF-2 was strongly expressed in tumor-associated fibroblasts, suggesting a tumor microenvironment-promoting function. Molecular cloning and expression studies of OSF-2 variants from patients identified an evolutionary conserved bona fide protein secretion signal (1MIPFLPMFSLLLLLIVNPINA21). OSF-2 enhanced cell migration and cellular survival under stress conditions, which could be mimicked by the extracellular administration of recombinant protein. Here, OSF-2 executes its functions via ß1 integrin, resulting in the phosphorylation of PI3K and activation of the Akt/PKB signaling pathway. Collectively, we suggest OSF-2 as a potential prognostic biomarker and drug target, promoting metastases by supporting the tumor microenvironment and lymph node metastases survival rather than by enhancing primary tumor proliferation or therapy resistance.

Keywords: HPV; biomarker; metastases; methylation; oral cancer; protein secretion; therapy resistance.


Conflict of interest statement

The authors declare that the research was conducted in the absence of any commercial or financial relationships that could be construed as a potential conflict of interest.

Figures

Figure 1
Figure 1
OSF-2 is significantly overexpressed in primary and metastatic HNCs. (A) RNA microarray analyses revealed at least 5-fold median overexpression of OSF-2 in the primary tumor (PT) versus normal tissue (N), as well as in lymph node metastases (LN M) versus N. PT versus LN M ratio indicated no further increase in OSF-2 expression in LN M (left). n = 15, * p < 0.05. (B) Survival analysis demonstrates that high OSF-2 expression levels correlate with reduced overall survival of HPV negative HNC patients; n = 75; p < 0.05. Hazard Ratio (Mantel-Haenszel) = 2.230. OSF-2 low < 12.3 (median), and OSF-2 high ≥ 12.3. (C) OSF-2 overexpression in PT versus N was confirmed by RT-PCR. OSF-2 up-regulation is shown in four representative cases (demographics see Table S1). GAPDH was used as a control. (D) Verification of OSF-2 microarray results on the protein level (n = 6). Higher expression of OSF-2 protein was found in PT versus N in five out of six representative cases. The uncropped western blot figures were presented in Figure S9.
Figure 2
Figure 2
OSF-2 expression correlates with HPV status and markers of metastatic disease. Bioinformatic analysis of the TCGA HNC patient cohort (n = 612). High OSF-2 expression significantly correlates with (A) HPV status, (B) perineural infiltration, (C) extracapsular spread (ECE), and (D) pathological lymph node status (pLNx) for p16 negative or unknown. N2a/b/c and N3a/b are pooled, respectively; AJCC 8th Edition. p-values and sample size (n) as indicated. * p < 0.05, ** p < 0.01, **** p < 0.0001, and ns indicates not significant.
Figure 3
Figure 3
OSF-2 expression does not directly contribute to cisplatin therapy resistance. (A) Selected cisplatin-resistant PicaCis and FaDuCis cells (grey) are highly resistant. Cells were treated with indicated cisplatin concentrations for 48 h and viability normalized to untreated controls. (B) Resistant PicaCis and FaDuCis cells show a lower number of cisplatin-induced DNA damage foci (γH2AX) compared to wt Pica/FaDu cells. Cells were treated with 20 µM cisplatin and analyzed by fluorescence microscopy after 24 h. Scale bar, 5 µm. (C) OSF-2 is not overexpressed in resistant PicaCis/FaDuCis versus sensitive wt cells. OSF-2 expression was quantified by RNASeq transcriptomics; relative mRNA expression is shown. (D) OSF-2 expression does not correlate with locoregional remission status after primary therapy (disease after curative treatment) in the TCGA HNC patient cohort. p-value and sample size (n) as indicated.
Figure 4
Figure 4
OSF-2 is expressed in the tumor microenvironment. (A) Immunohistochemical analysis of OSF-2 expression in primary HNC tissue. Intense staining was observed in cancer cells (1,2), but also in the juxtatumoral stroma (3,4). Scale bars, 20 µm. (B) RT-PCR of primary tumor cells and CAFs revealed higher expression of OSF-2 in CAFs. GAPDH was used as a control. (C) Up-regulation of OSF-2 in CAFs compared to primary tumor cells was confirmed by quantitative real-time-PCR. Up-regulation is shown by lower CT values and thus, a lower relative expression for CAFs. OSF-2 expression in primary tumor cells (PT, black) and CAFs (grey) is shown compared to RNA-Pol II expression (OSF-2/RNA-Pol II; left axis), and as relative expression ratio R (right axis). R = 21.18, n = 2, ** p < 0.005. The uncropped western blot figures were presented in Figure S10.
Figure 5
Figure 5
HNC patients express various OSF-2 isoforms differing in their C-terminal domain. (A) Proposed protein domain organization of OSF-2 (modified from [40]). The canonical sequence (wt) consists of 23 exons building the N-terminal secretion signal (blue, identified in this study), the EMI domain (red, exon 2–3), four Fas1 domains (green, exons 3–13), and the variable C-terminal domain (CTD, yellow, exons 13–23). (B) Expression of OSF-2 isoforms was examined by sequence analyses of the OSF-2 C-terminus (exon 13–21), and compared to the ‘canonical’ sequence (wt). In total, 12 isoforms were identified. Grey dots represent verified exons, black dots lack exons (deletions), and white dots have additional exons (insertions). OSF-2 isoform distribution was analyzed in multiple clones of 3 patients (PT, LN M, N) from our study cohort (B), isolated primary tumor cells and corresponding CAFs (C), as well as in different HNC tumor cell lines (D).
Figure 6
Figure 6
OSF-2 contains an evolutionarily conserved secretion signal. (A) Alignment of predicted secretion sequences in various OSF-2 homologs. Phylogram constructed on the basis of amino acid sequence similarities depicting the evolutionary relationships among OSF-2 proteins of different species. The sequence of the predicted human secretion signal (aa1-21) is conserved in all compared homologs. * Identical residues (dark grey), conserved substitutions/similar characteristic (light grey), semi-conserved substitution/similar shape (white). Organisms and amino acid positions are indicated. (B) OSF-2-GFP transfection in different tumor cell lines revealed a cytoplasmic granular localization. No secretion granulae were observed upon expression of the secretion mutant, ΔSec-GFP. (C) Expression of the signal alone fused to GFP (aa1-21; Sec-GFP) was sufficient for the formation of secretion vesicles. GFP expression served as the negative control. Scale bars, 5 µm. (D) Western blot confirming OSF-2 secretion. (E) Immunoblot analysis of cell fractions from OSF-2-GFP and ΔSec-GFP HEK293T transfectants. Only OSF-GFP was detectable in the membrane fraction of secretion vesicles and the supernatant. In contrast, the OSF-ΔSec-GFP secretion mutant failed to be incorporated into vesicles or to be secreted. Probing with anti-GAPDH (cytoplasm), anti-Vimentin (membrane, cytoskeleton), and anti-Lamin B1 (nuclear) Abs served as controls for lysate preparation. Representative results for n = 2 are shown. The uncropped western blot figures were presented in Figures S11 and S12.
Figure 7
Figure 7
OSF-2 promotes cell migration and cellular survival under stress conditions. Administration of recombinant OSF-2 (100 ng/mL) did not affect HNC cell (FaDu) proliferation (A), but resulted in increased cell migration (B), and improved survival under serum deprivation (C). (D,E) Spheroid and colony formation assays revealed clonogenicity of three OSF-2 overexpressing HNC cell lines (controls without treatment). Scale bar, 100 µm. (F) Presence of recombinant OSF-2 increases the number of formed colonies using Fadu cells. p-values of unpaired t-testing as indicated. * p < 0.05, ** p < 0.01, **** p < 0.0001.
Figure 8
Figure 8
OSF-2 stimulates the Akt/PKB pathway via integrin-dependent PI3-Kinase activation. (A,B) β1-integrin, but not α5 integrin is induced by the addition of rOSF-2 (10, 100 ng/mL). Integrin receptor expression was analyzed by Western blot in HNSCCUM-02T cells. Actin served as the loading control. Representative results (n = 2) are shown. Densitometric analysis of detected bands is shown in (B). (C) Specific phosphorylation of Akt1/PKBα on Ser473 was detected in HNSCCUM-02T cells. Insulin and serum-containing medium (+FCS) served as positive, serum deprivation (−FCS), and PI3K-inhibitor (LY294002; +FCS) treatment as negative controls for staining. Scale bar, 5 µm. (D) Quantification of p-Akt positive cells. At least 200 cells from three separate images were examined, visually inspected, and counted as p-Akt positive or negative. Ratio of p-Akt positive cells (= #pAkt positive/all counted cells) is shown for indicated treatments. All treatments, except PI3K-inhibitor, and +FCS, were performed under serum starvation conditions. (E) Akt1/PKBα phosphorylation was confirmed by Western blot analysis using HNSCCUM-02T cells. Akt1/PKBα phosphorylation was induced by recombinant OSF-2 (rOSF-2) and conditioned medium under serum-free conditions. OSF-2-induced phosphorylation was prevented by PI3K inhibition. Actin served as the loading control. Representative results (n = 2) are shown. (F) HNC cancer cell (Fadu) survival was reduced after treatment with r-OSF-2 and a PI3K-inhibitor (LY294002). ns: p > 0.05; * p ≤ 0.05. The uncropped western blot figures were presented in Figure S13.
Figure 9
Figure 9
Proposed OSF-2 function in promoting (lymph node) metastases by regulating the tumor microenvironment and cellular survival. OSF-2 is overexpressed in tumor cells, as well as in cancer-associated fibroblasts (CAFs) at the primary tumor and lymph node metastatic sites in HNC. Though, it is likely that these mechanisms are also relevant for distant site metastases in other cancer types. Due to the conserved N-terminal secretion signal, OSF-2 seems to execute its tumor-promoting functions not mainly intracellularly, but extracellularly in the tumor microenvironment. Here, secretion inhibitors could be therapeutically relevant. OSF-2 modulates the tumor microenvironment by integrin-dependent activation of Akt/PKB pathways and downstream signaling, particularly critical under stress conditions.

Similar articles

Cited by

References

    1. Gul D., Habtemichael N., Dietrich D., Dietrich J., Gosswein D., Khamis A., Deuss E., Kunzel J., Schneider G., Strieth S., et al. Identification of cytokeratin24 as a tumor suppressor for the management of head and neck cancer. Biol. Chem. 2021. Epub ahead of print . - DOI - PubMed
    1. Alsahafi E., Begg K., Amelio I., Raulf N., Lucarelli P., Sauter T., Tavassoli M. Clinical update on head and neck cancer: Molecular biology and ongoing challenges. Cell Death Dis. 2019;10:540. doi: 10.1038/s41419-019-1769-9. - DOI - PMC - PubMed
    1. Ferlay J., Colombet M., Soerjomataram I., Mathers C., Parkin D.M., Pineros M., Znaor A., Bray F. Estimating the global cancer incidence and mortality in 2018: GLOBOCAN sources and methods. Int. J. Cancer. 2019;144:1941–1953. doi: 10.1002/ijc.31937. - DOI - PubMed
    1. Ferlito A., Shaha A.R., Silver C.E., Rinaldo A., Mondin V. Incidence and sites of distant metastases from head and neck cancer. ORL J. Oto-Rhino-Laryngol. Its Relat. Spec. 2001;63:202–207. doi: 10.1159/000055740. - DOI - PubMed
    1. Cohen R.B. Current challenges and clinical investigations of epidermal growth factor receptor (EGFR)- and ErbB family-targeted agents in the treatment of head and neck squamous cell carcinoma (HNSCC) Cancer Treat. Rev. 2014;40:567–577. doi: 10.1016/j.ctrv.2013.10.002. - DOI - PubMed

LinkOut - more resources