

Comparative Transcriptome Analysis Reveals Regulatory Mechanism of Long Non-Coding RNAs during Abdominal Preadipocyte Adipogenic Differentiation in Chickens
- PMID: 35565526
- PMCID: PMC9101879
- DOI: 10.3390/ani12091099
Comparative Transcriptome Analysis Reveals Regulatory Mechanism of Long Non-Coding RNAs during Abdominal Preadipocyte Adipogenic Differentiation in Chickens
Abstract
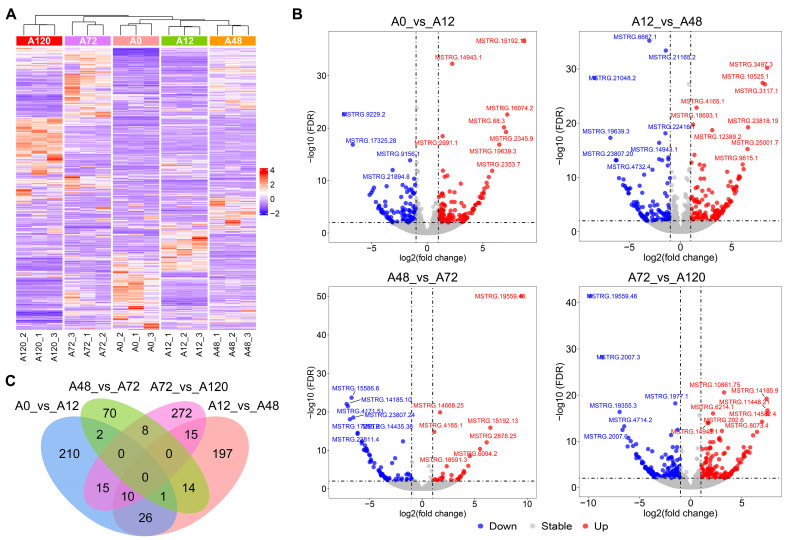
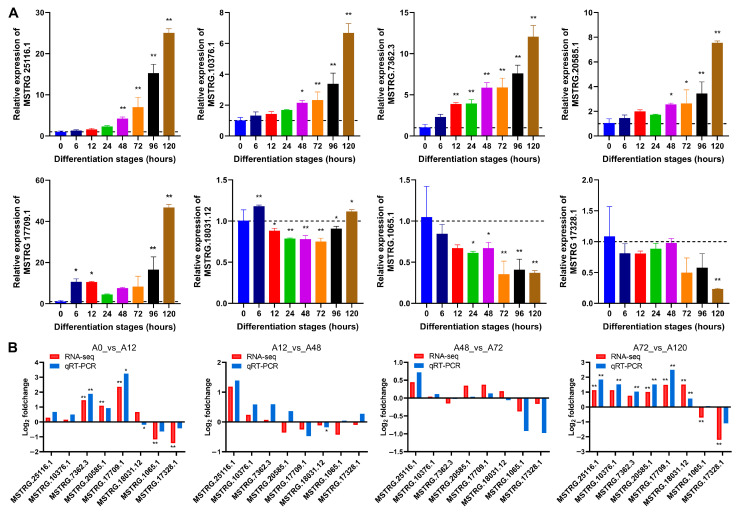
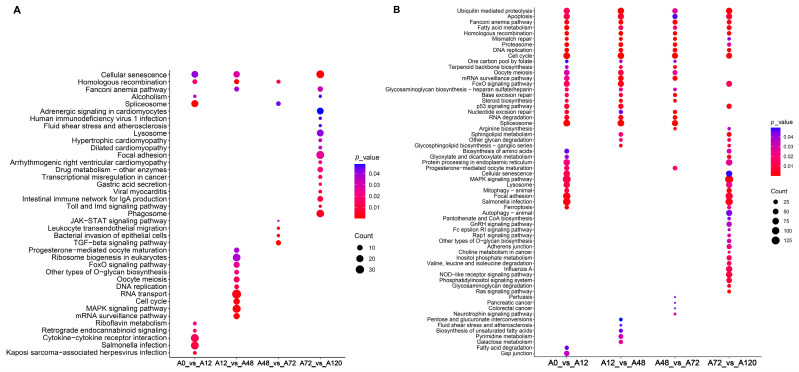
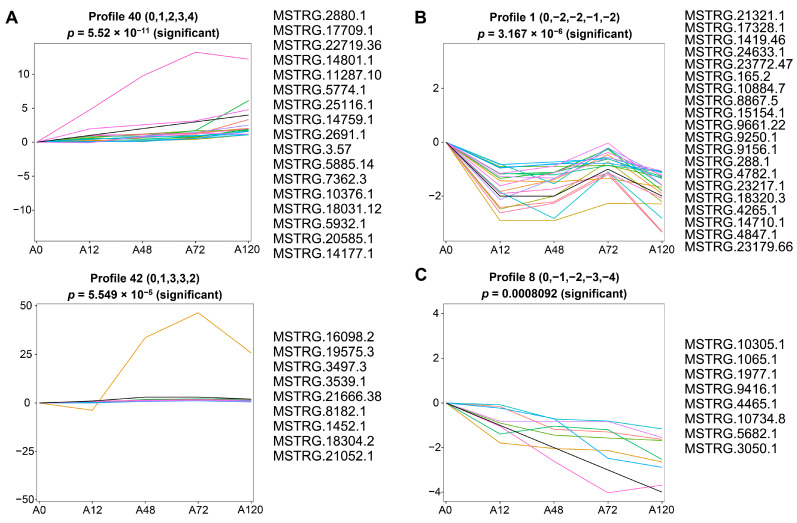
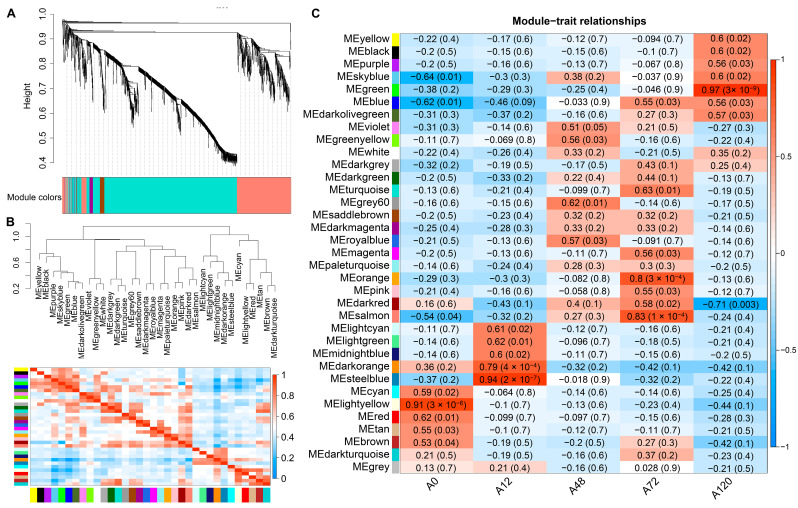
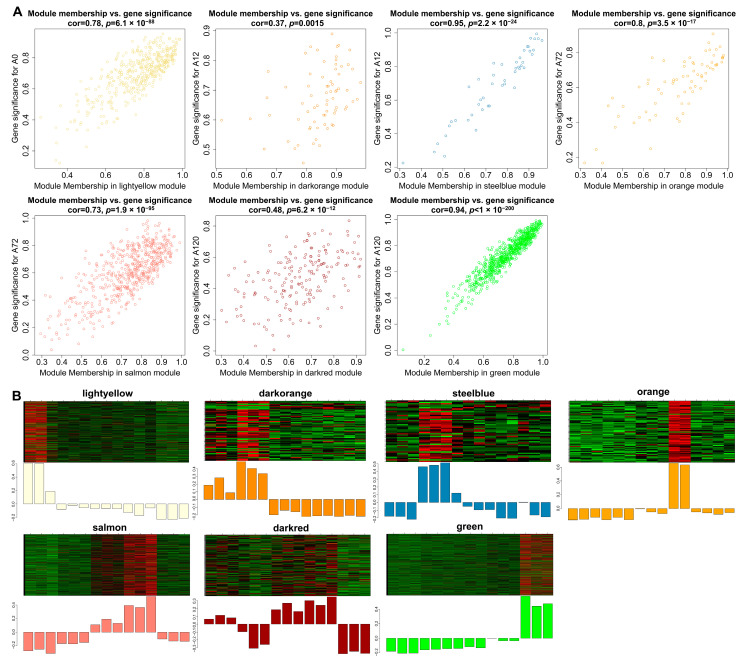
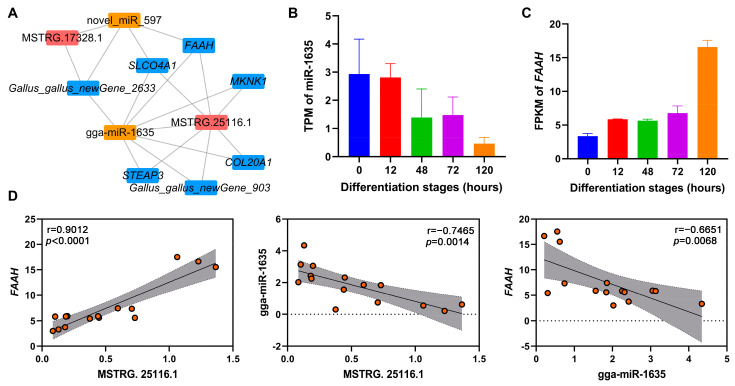
Long non-coding RNAs (lncRNAs) are implicated in mammalian adipogenesis and obesity. However, their genome-wide distribution, expression profiles, and regulatory mechanisms during chicken adipogenesis remain rarely understood. In the present study, lncRNAs associated with adipogenesis were identified from chicken abdominal adipocytes at multiple differentiation stages using Ribo-Zero RNA-seq. A total of 15,179 lncRNAs were identified and characterized by stage-specific expression patterns. Of these, 840 differentially expressed lncRNAs were detected, and their cis- and trans-target genes were significantly enriched in multiple lipid-related pathways. Through weighted gene co-expression network analysis (WGCNA) and time-series expression profile clustering analysis, 14 key lncRNAs were identified as candidate regulatory lncRNAs in chicken adipogenic differentiation. The cis- and trans-regulatory interactions of key lncRNAs were constructed based on their differentially expressed cis- and trans-target genes, respectively. We also constructed a competing endogenous RNA (ceRNA) network based on the key lncRNAs, differentially expressed miRNAs, and differentially expressed mRNAs. MSTRG.25116.1 was identified as a potential regulator of chicken abdominal preadipocyte adipogenic differentiation by acting as a transcriptional trans-regulator of fatty acid amide hydrolase (FAAH) gene expression and/or a ceRNA that post-transcriptionally mediates FAAH gene expression by sponging gga-miR-1635.
Keywords: adipogenic differentiation; chicken; competing endogenous RNA; lncRNAs.
Conflict of interest statement
The authors declare no conflict of interest.
Figures
Similar articles
-
A genome-wide landscape of mRNAs, lncRNAs, circRNAs and miRNAs during intramuscular adipogenesis in cattle.BMC Genomics. 2022 Oct 6;23(1):691. doi: 10.1186/s12864-022-08911-z. BMC Genomics. 2022. PMID: 36203142 Free PMC article.
-
Identification of Long Non-Coding RNA-Associated Competing Endogenous RNA Network in the Differentiation of Chicken Preadipocytes.Genes (Basel). 2019 Oct 12;10(10):795. doi: 10.3390/genes10100795. Genes (Basel). 2019. PMID: 31614854 Free PMC article.
-
Dynamic Expression and Regulatory Network of Circular RNA for Abdominal Preadipocytes Differentiation in Chicken (Gallus gallus).Front Cell Dev Biol. 2021 Nov 12;9:761638. doi: 10.3389/fcell.2021.761638. eCollection 2021. Front Cell Dev Biol. 2021. PMID: 34869349 Free PMC article.
-
Comprehensive Transcriptome Analysis of lncRNAs Reveals the Role of lncAD in Chicken Intramuscular and Abdominal Adipogenesis.J Agric Food Chem. 2020 Mar 18;68(11):3678-3688. doi: 10.1021/acs.jafc.9b07405. Epub 2020 Mar 9. J Agric Food Chem. 2020. PMID: 32125837
-
Long Non-coding RNAs as Local Regulators of Pancreatic Islet Transcription Factor Genes.Front Genet. 2018 Nov 6;9:524. doi: 10.3389/fgene.2018.00524. eCollection 2018. Front Genet. 2018. PMID: 30459811 Free PMC article. Review.
Cited by
-
Long non-coding RNA (LncRNA) and epigenetic factors: their role in regulating the adipocytes in bovine.Front Genet. 2024 Oct 3;15:1405588. doi: 10.3389/fgene.2024.1405588. eCollection 2024. Front Genet. 2024. PMID: 39421300 Free PMC article. Review.
-
Identification and Functional Prediction of Long Non-Coding RNA in Longissimus Dorsi Muscle of Queshan Black and Large White Pigs.Genes (Basel). 2023 Jan 12;14(1):197. doi: 10.3390/genes14010197. Genes (Basel). 2023. PMID: 36672938 Free PMC article.
-
Understanding lncRNAs: key regulators of myogenesis and lipogenesis in farm animals.Front Vet Sci. 2025 Feb 14;12:1540613. doi: 10.3389/fvets.2025.1540613. eCollection 2025. Front Vet Sci. 2025. PMID: 40027357 Free PMC article. Review.
References
-
- Leclercq B., Blum J.C., Boyer J.P. Selecting broilers for low or high abdominal fat: Initial observations. Br. Poult. Sci. 1980;21:107–113. doi: 10.1080/00071668008416644. - DOI
Grants and funding
LinkOut - more resources
Full Text Sources
