

Seasonality and Ecological Suitability Modelling for Anthrax (Bacillus anthracis) in Western Africa
- PMID: 35565571
- PMCID: PMC9105891
- DOI: 10.3390/ani12091146
Seasonality and Ecological Suitability Modelling for Anthrax (Bacillus anthracis) in Western Africa
Abstract
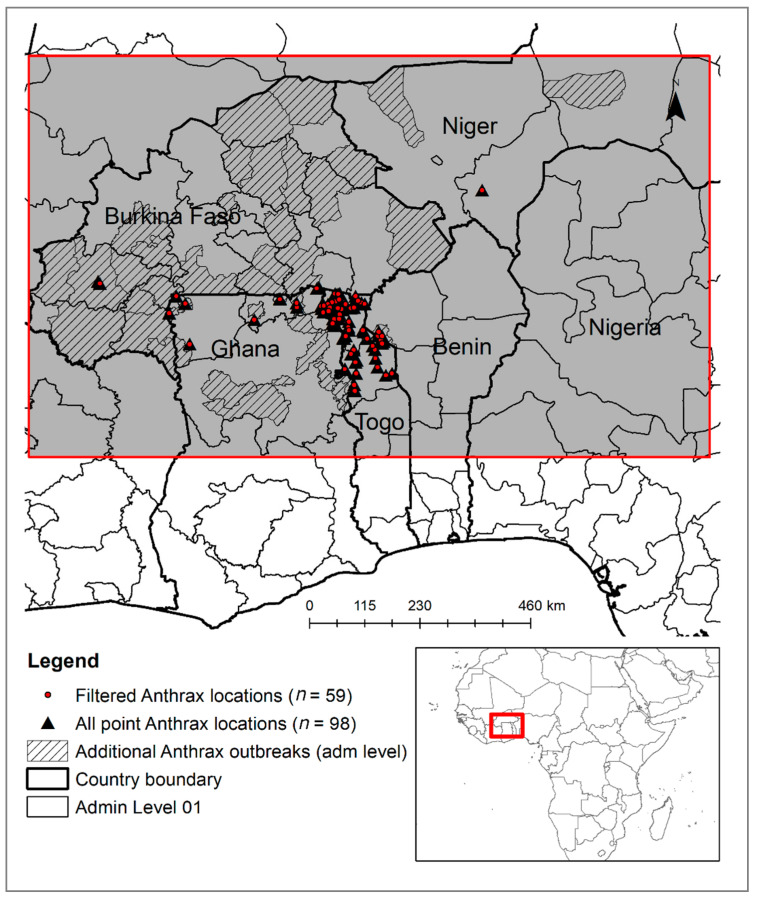
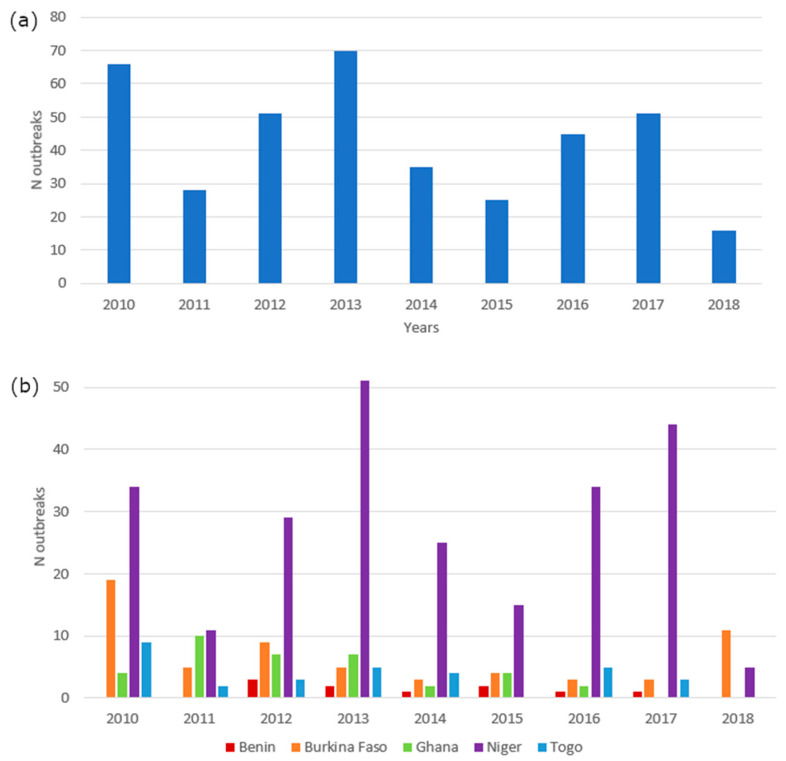
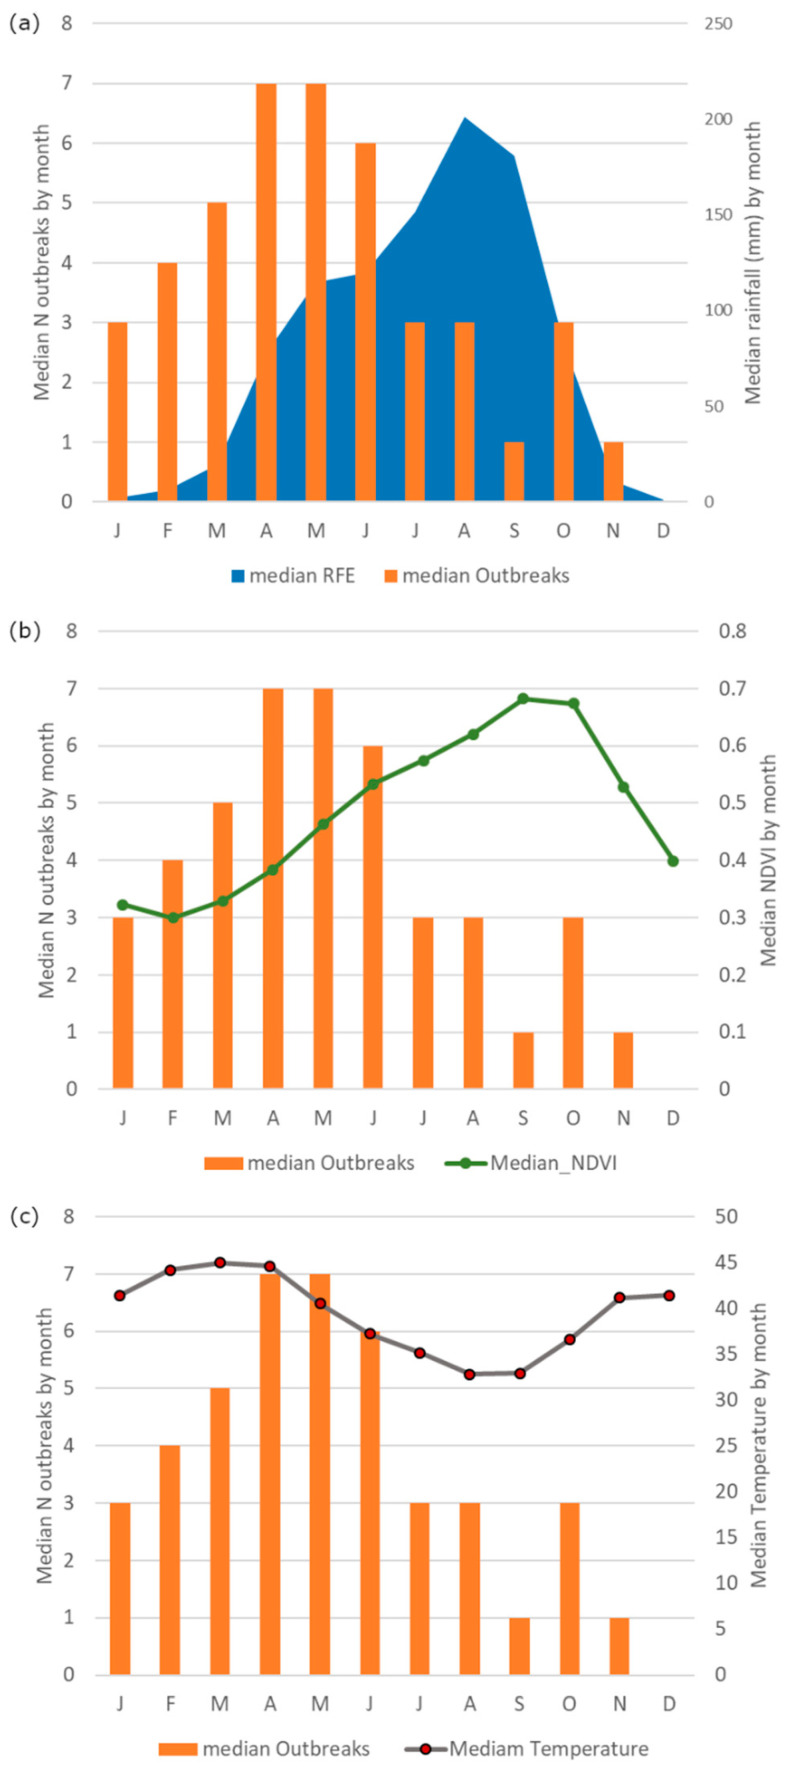
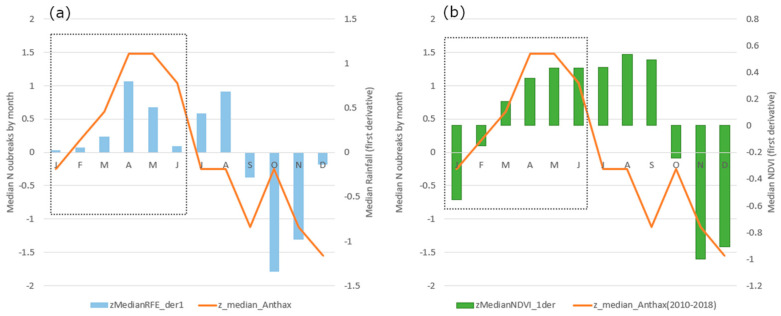
Anthrax is hyper-endemic in West Africa affecting wildlife, livestock and humans. Prediction is difficult due to the lack of accurate outbreak data. However, predicting the risk of infection is important for public health, wildlife conservation and livestock economies. In this study, the seasonality of anthrax outbreaks in West Africa was investigated using climate time series and ecological niche modeling to identify environmental factors related to anthrax occurrence, develop geospatial risk maps and identify seasonal patterns. Outbreak data in livestock, wildlife and humans between 2010 and 2018 were compiled from different sources and analyzed against monthly rates of change in precipitation, normalized difference vegetation index (NDVI) and land surface temperature. Maximum Entropy was used to predict and map the environmental suitability of anthrax occurrence. The findings showed that: (i) Anthrax outbreaks significantly (99%) increased with incremental changes in monthly precipitation and vegetation growth and decremental changes in monthly temperature during January-June. This explains the occurrence of the anthrax peak during the early wet season in West Africa. (ii) Livestock density, precipitation seasonality, NDVI and alkaline soils were the main predictors of anthrax suitability. (iii) Our approach optimized the use of limited and heterogeneous datasets and ecological niche modeling, demonstrating the value of integrated disease notification data and outbreak reports to generate risk maps. Our findings can inform public, animal and environmental health and enhance national and regional One Health disease control strategies.
Keywords: West Africa; anthrax; climate variability; ecological niche modeling; seasonality; time series analysis.
Conflict of interest statement
The authors declare no conflict of interest.
Figures
References
-
- World Health Organization. Food and Agriculture Organization of the United Nations. World Organisation for Animal Health . Anthrax in Humans and Animals. 4th ed. World Health Organization; Geneva, Switzerland: 2008.
-
- Obanda V., Otieno V.A., Kingori E.M., Ndeereh D., Lwande O.W., Chiyo P.I. Identifying Edaphic Factors and Normalized Difference Vegetation Index Metrics Driving Wildlife Mortality from Anthrax in Kenya’s Wildlife Areas. Front. Ecol. Evol. 2021;9:939. doi: 10.3389/fevo.2021.643334. - DOI
LinkOut - more resources
Full Text Sources
