. 2022 Apr 19;14(9):1699.
doi: 10.3390/nu14091699.

Myristica fragrans Extract Regulates Gut Microbes and Metabolites to Attenuate Hepatic Inflammation and Lipid Metabolism Disorders via the AhR-FAS and NF-κB Signaling Pathways in Mice with Non-Alcoholic Fatty Liver Disease

Affiliations

Myristica fragrans Extract Regulates Gut Microbes and Metabolites to Attenuate Hepatic Inflammation and Lipid Metabolism Disorders via the AhR-FAS and NF-κB Signaling Pathways in Mice with Non-Alcoholic Fatty Liver Disease

Wenyu Zhao et al. Nutrients. .

Abstract

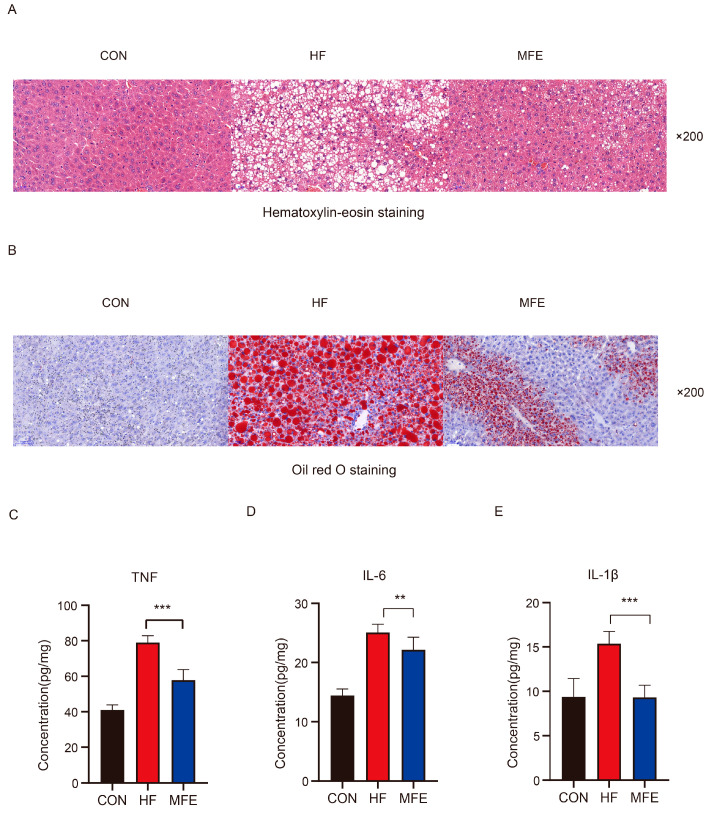
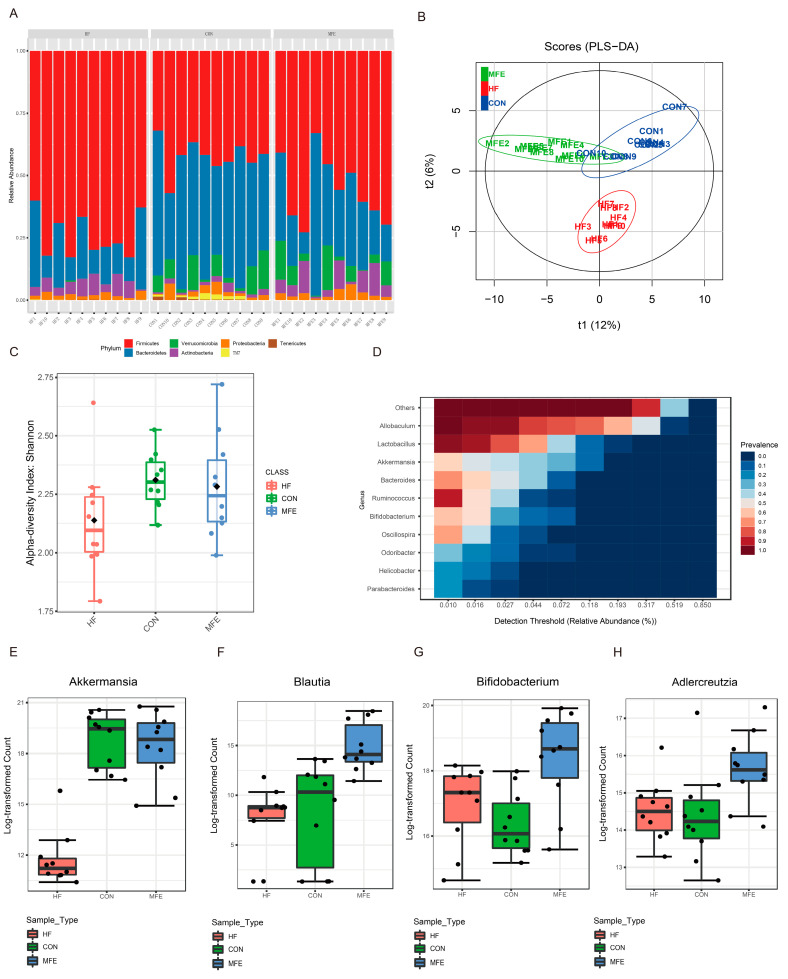
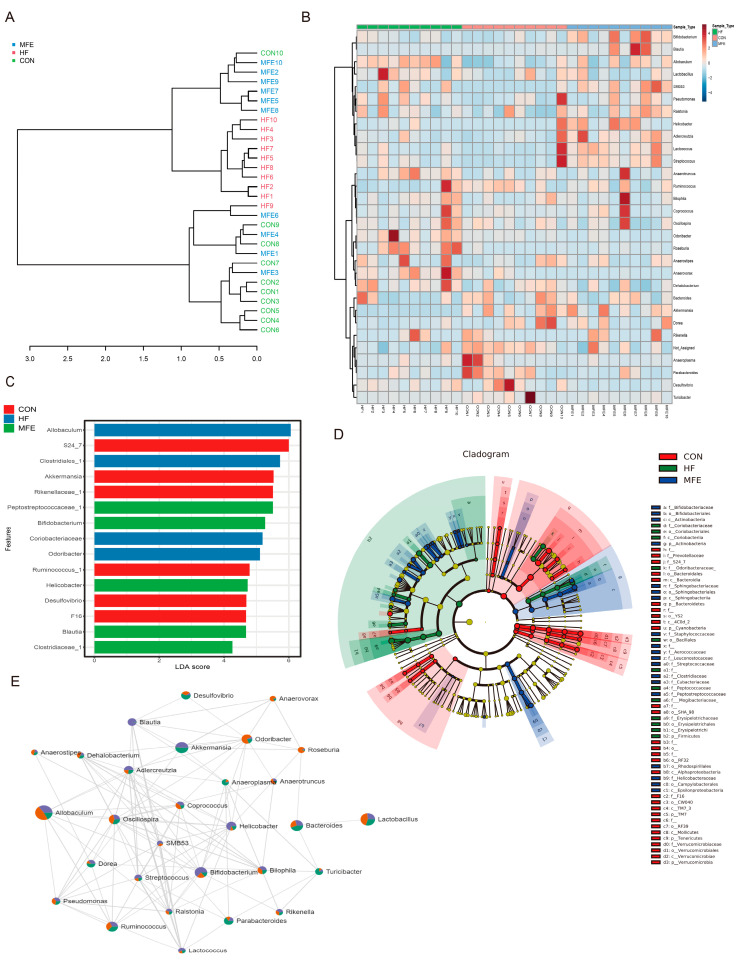
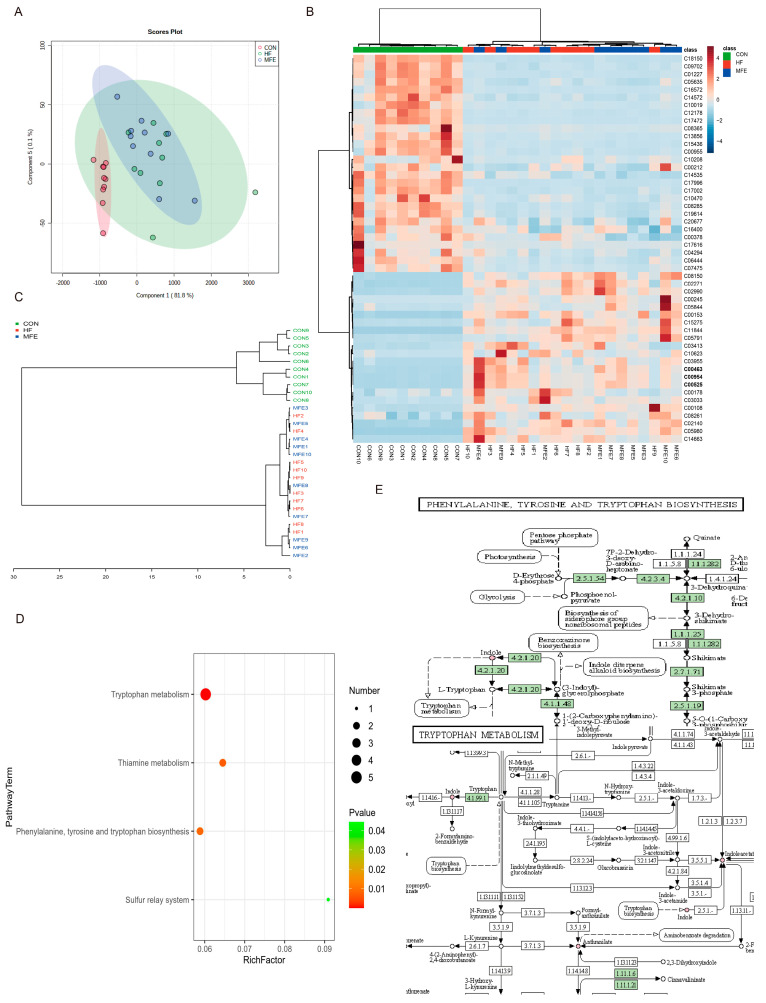
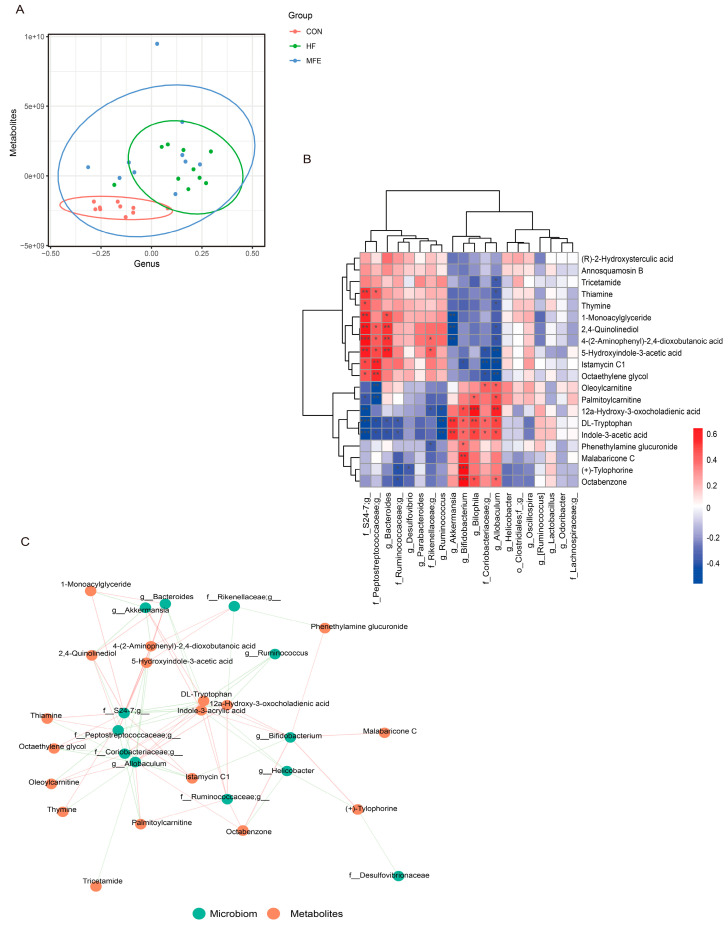
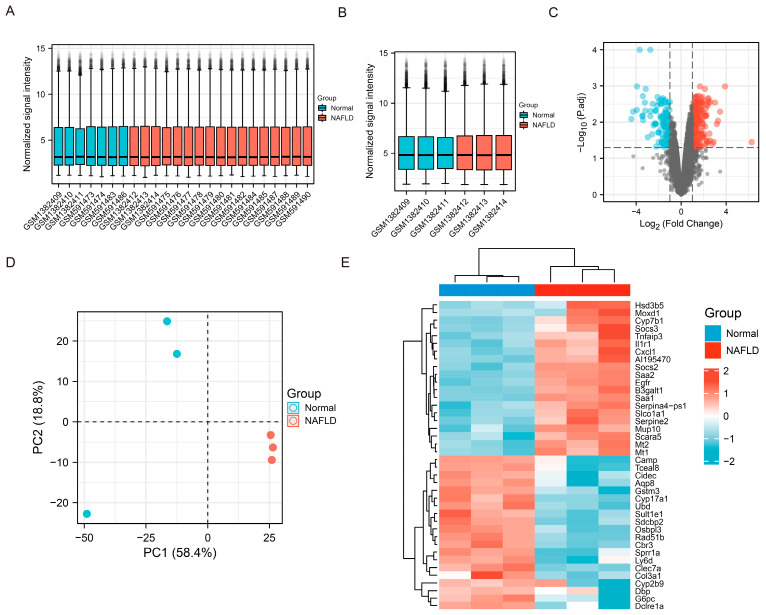
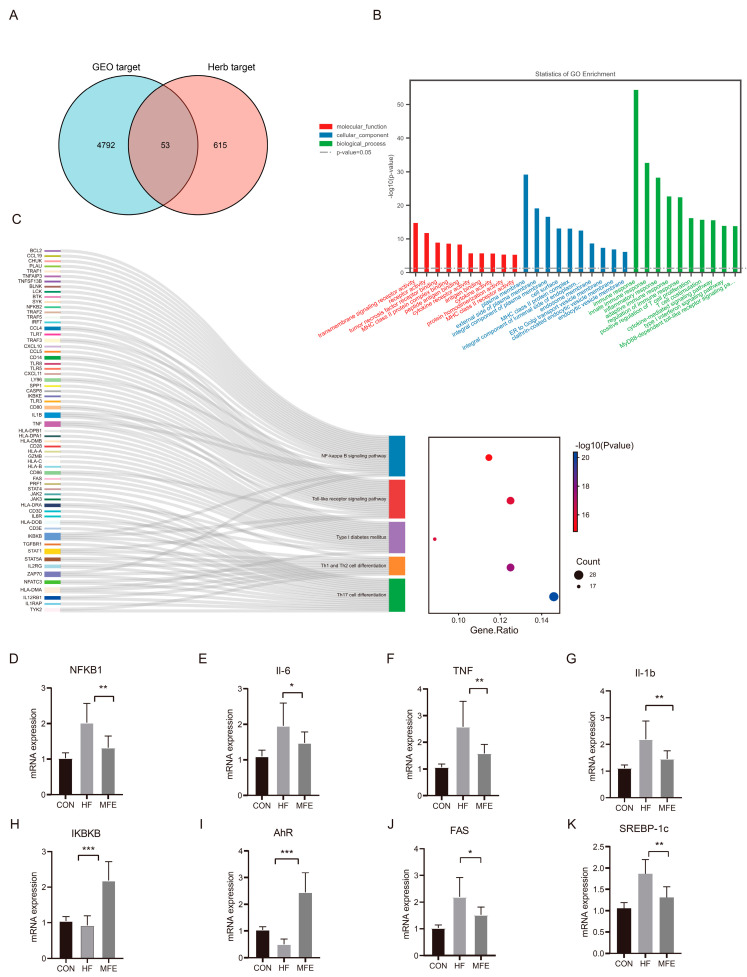
Recent studies have shown that non-alcoholic fatty liver disease (NAFLD) is closely related to the gut microbiome. Myristica fragrans is widely used as a traditional seasoning and has a therapeutic effect on gastrointestinal diseases. Although previous studies have shown that M. fragrans extracts have anti-obesity and anti-diabetes effects in mice fed a high-fat diet, few studies have determined the active components or the corresponding mechanism in vivo. In this study, for the first time, an M. fragrans extract (MFE) was shown to be a prebiotic that regulates gut microbes and metabolites in mice fed a high-fat diet. Bioinformatics, network pharmacology, microbiome, and metabolomics analyses were used to analyze the nutrient-target pathway interactions in mice with NAFLD. The National Center for Biotechnology Information Gene Expression Omnibus database was used to analyze NAFLD-related clinical data sets to predict potential targets. The drug database and disease database were then integrated to perform microbiome and metabolomics analyses to predict the target pathways. The concentrations of inflammatory factors in the serum and liver, such as interleukin-6 and tumor necrosis factor-α, were downregulated by MFE. We also found that the hepatic concentrations of low-density lipoprotein cholesterol, total cholesterol, and triglycerides were decreased after MFE treatment. Inhibition of the nuclear factor kappa B (NF-κB) pathway and downregulation of the fatty acid synthase (FAS)-sterol regulatory element-binding protein 1c pathway resulted in the regulation of inflammation and lipid metabolism by activating tryptophan metabolite-mediated aryl hydrocarbon receptors (AhR). In summary, MFE effectively attenuated inflammation and lipid metabolism disorders in mice with NAFLD through the NF-κB and AhR-FAS pathways.

Keywords: Myristica fragrans extract; aryl hydrocarbon receptor; gut microbes; metabolites; non-alcoholic fatty liver disease; nuclear factor kappa B.


Conflict of interest statement

This work has not been published previously and the authors declare no conflict of interest.

Figures

Figure 1
Figure 1
Effects of MFE on hepatic lipid accumulation and inflammatory factor levels in high-fat-diet mice. (A) Hematoxylin-eosin staining (H&E) of mice liver section, 200× magnification. (B) Oil Red O staining of mice liver section, 200× magnification. (C) Concentration levels of TNF-α in the liver. (D) Concentration levels of Il-6 in the liver. (E) Concentration levels of IL-1β in the liver. Data are shown as mean ± SD. (For each group, n = 10, ** p < 0.01; *** p < 0.001).
Figure 2
Figure 2
Effects of MFE on the abundance and diversity of gut microbiota. (A) Bacteria composition at the phylum level in each sample (top7). (B) Partial least-squares discriminant analysis (PLS-DA) of beta diversity in three groups (CON, HF, and MFE). (C) The Shannon diversity index of alpha diversity in three groups (CON, HF, and MFE). (D) Correlation analysis of the core gut bacteria at the genus level. (EH) The bacteria ((E) Akkermansia, (F) Blautia, (G) Bifidobacterium, and (H) Adlercreutzia) were significantly upregulated by MFE at the genus level in high-fat-diet mice. Data are shown as mean ± SD.
Figure 3
Figure 3
Correlation and difference analysis of intestinal flora via MFE in mice fed a high-fat diet. (A) Phylogenetic tree of correlation between samples at genus level of three groups (CON, HF, and MFE). (B) Heat map of the correlation between samples at the genus level (Top30) of three groups. (C) Linear Discriminant Analysis (LDA) effect size (LEfSe) analysis at OTU level in three groups. (D) A circular cladogram was generated to show the differentially abundant taxa. (E) Genus-level gut microbe network diagram of three groups (green: CON, orange: HF, and blue: MFE) to show correlations between genera and proportions among groups. Data are shown as mean ± SD. (For each group, n = 10).
Figure 4
Figure 4
Effects of MFE on gut metabolites. (A) Partial least-squares discriminant analysis (PLS-DA) of metabolites of three groups (CON, HF, and MFE). (B) Heat map for metabolite enrichment change analysis (Top50) of three groups. (C) Phylogenetic tree of correlation between samples of metabolites in three groups (CON, HF, and MFE). (D) The pathway enrichment analysis of metabolites. (E) KEGG map shows metabolites in enriched pathways. Data are shown as mean ± SD. (For each group, n = 10).
Figure 5
Figure 5
Omics analysis of the intestinal flora metabolites in NAFLD mice with MFE treatment. (A) PLS-DA (Partial Least Squares Discriminant) Analysis of intestinal microbes at genus level and metabolites. (Variable Importance for the Projection, VIP > 1) (B) Heat map of correlation analysis between intestinal microbes at genus level and metabolites in MFE group (red represents positive correlation and blue represents negative correlation). (C) Correlation network diagram between microbiota and metabolites in MFE group. Data are shown as mean ± SD. (For each group, n = 10, * p < 0.05; ** p < 0.01; *** p < 0.001).
Figure 6
Figure 6
Mining and Analysis of GEO (Gene expression omnibus) database related to NAFLD. (A,B) The normalization of data sets (GSE151158 GSE57425). (C) Volcano plot of differential gene analysis (|logFC| > 1; p-value < 0.05). (D) Principal component analysis (PCA) of each group of samples in the GSE57425 data set. (E) Heat map of top 20 gene expressions (red: high expression; blue: low expression) in the expression profile. Data are shown as mean ± SD.
Figure 7
Figure 7
Effects of MFE on NF-κB pathway related to liver inflammation and the AhR–FAS signaling pathway related to the intestinal tryptophan metabolism pathway. (A) The intersection of the targets of the GEO database and the targets of the Chinese herbal medicine database. (B) Gene ontology (GO) analysis of 53 targets. (C) KEGG pathway analysis (DK) The targets of NF-κB pathway signaling (NKFB1, Il-6, TNF, Il-1b, and IKBKB) and The targets of AhR–FAS signaling (AhR, FAS, and SREBP-1c). (For each group, n = 10, * p < 0.05; ** p < 0.01; *** p < 0.001).

Similar articles

Cited by

References

    1. Brunt E.M., Wong W.S., Nobili V., Day C.P., Rinella M.E. Nonalcoholic fatty liver disease. Nat. Rev. Dis. Primers. 2015;1:15080. doi: 10.1038/nrdp.2015.80. - DOI - PubMed
    1. Borrelli A., Bonelli P., Tuccillo F.M., Goldfine I.D., Evans J.L., Buonaguro F.M., Mancini A. Role of gut microbiota and oxidative stress in the progression of non-alcoholic fatty liver disease to hepatocarcinoma: Current and innovative therapeutic approaches. Redox Biol. 2018;15:467–479. doi: 10.1016/j.redox.2018.01.009. - DOI - PMC - PubMed
    1. Bedossa P. Pathology of non-alcoholic fatty liver disease. Liver Int. 2017;37:85. doi: 10.1111/liv.13301. - DOI - PubMed
    1. Han H., Jiang Y., Wang M., Melaku M., Liu L., Zhao Y., Everaert N., Yi B., Zhang H. Intestinal dysbiosis in nonalcoholic fatty liver disease (NAFLD): Focusing on the gut–liver axis. Crit. Rev. Food Sci. Nutr. 2021:1–18. doi: 10.1080/10408398.2021.1966738. - DOI - PubMed
    1. Rahman K., Desai C., Iyer S.S., Thorn N.E., Kumar P., Liu Y., Smith T., Neish A.S., Li H., Tan S. Loss of Junctional Adhesion Molecule A Promotes Severe Steatohepatitis in Mice on a Diet High in Saturated Fat, Fructose, and Cholesterol-ScienceDirect. Gastroenterology. 2016;151:733–746. doi: 10.1053/j.gastro.2016.06.022. - DOI - PMC - PubMed