

Gut Microbiota and Phenotypic Changes Induced by Ablation of Liver- and Intestinal-Type Fatty Acid-Binding Proteins
- PMID: 35565729
- PMCID: PMC9099671
- DOI: 10.3390/nu14091762
Gut Microbiota and Phenotypic Changes Induced by Ablation of Liver- and Intestinal-Type Fatty Acid-Binding Proteins
Abstract
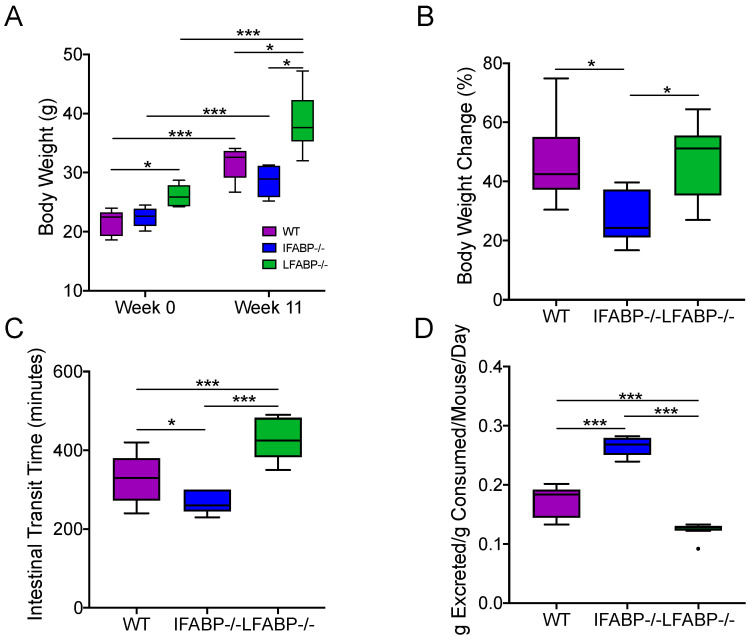
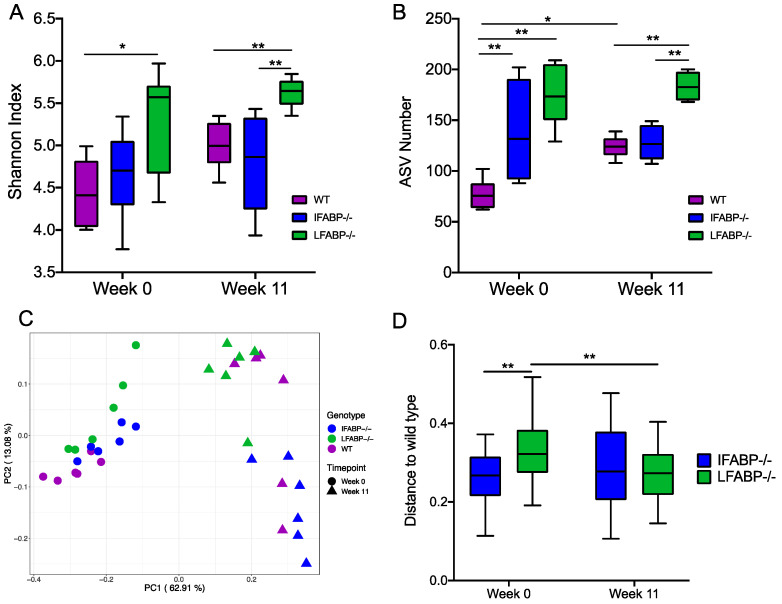
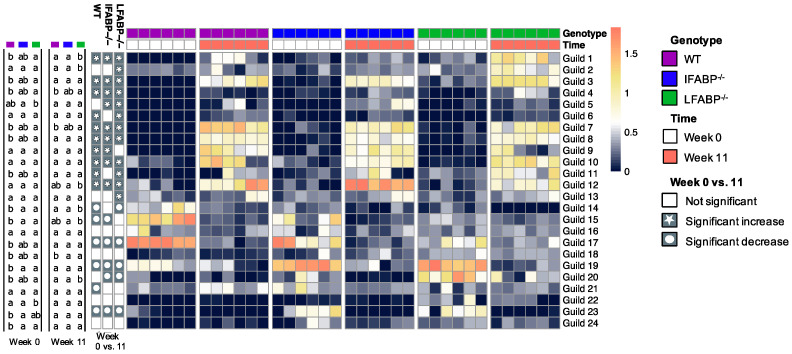
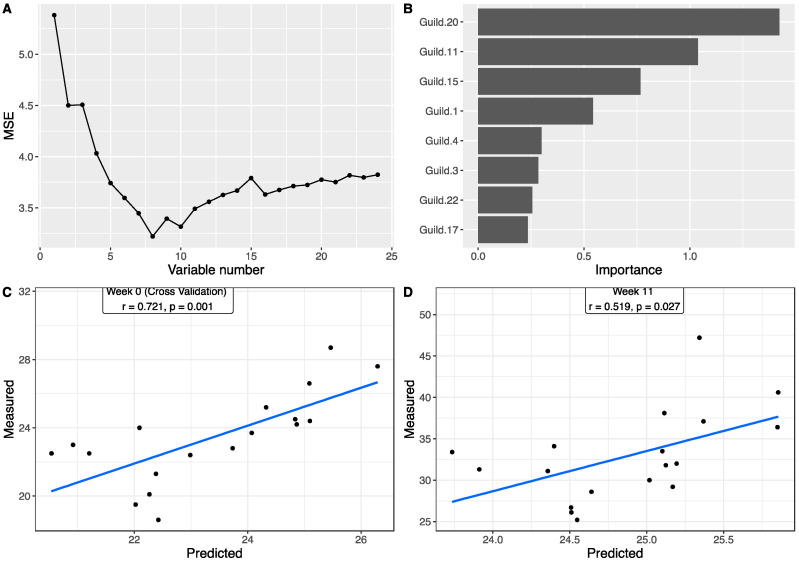
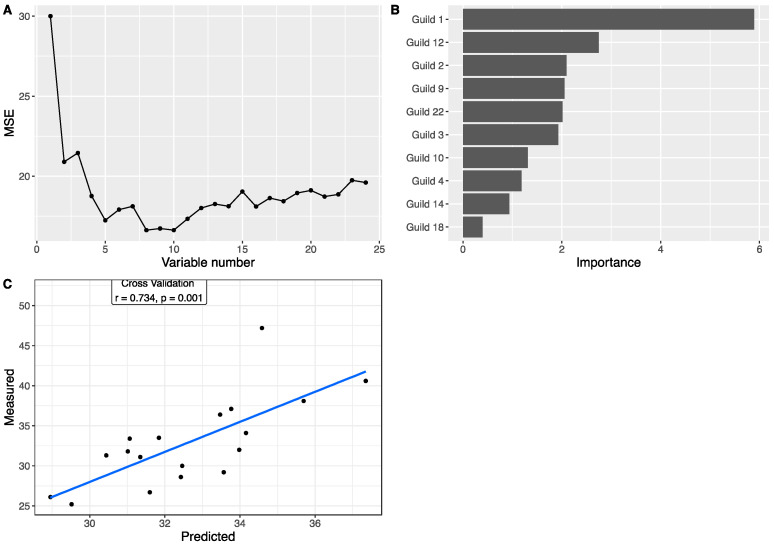
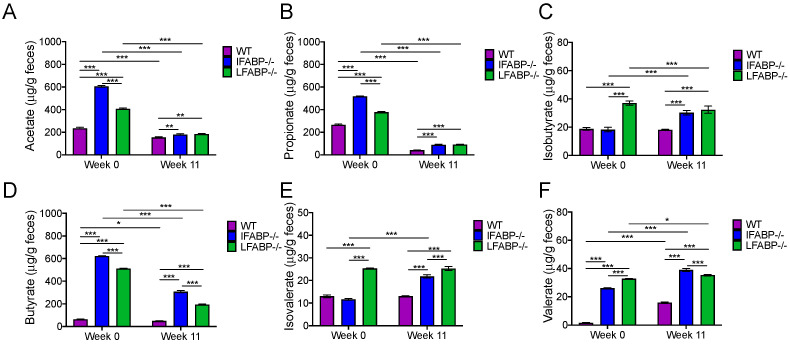
Intestinal fatty acid-binding protein (IFABP; FABP2) and liver fatty acid-binding protein (LFABP; FABP1) are small intracellular lipid-binding proteins. Deficiency of either of these proteins in mice leads to differential changes in intestinal lipid transport and metabolism, and to markedly divergent changes in whole-body energy homeostasis. The gut microbiota has been reported to play a pivotal role in metabolic process in the host and can be affected by host genetic factors. Here, we examined the phenotypes of wild-type (WT), LFABP-/-, and IFABP-/- mice before and after high-fat diet (HFD) feeding and applied 16S rRNA gene V4 sequencing to explore guild-level changes in the gut microbiota and their associations with the phenotypes. The results show that, compared with WT and IFABP-/- mice, LFABP-/- mice gained more weight, had longer intestinal transit time, less fecal output, and more guilds containing bacteria associated with obesity, such as members in family Desulfovibrionaceae. By contrast, IFABP-/- mice gained the least weight, had the shortest intestinal transit time, the most fecal output, and the highest abundance of potentially beneficial guilds such as those including members from Akkermansia, Lactobacillus, and Bifidobacterium. Twelve out of the eighteen genotype-related bacterial guilds were associated with body weight. Interestingly, compared with WT mice, the levels of short-chain fatty acids in feces were significantly higher in LFABP-/- and IFABP-/- mice under both diets. Collectively, these studies show that the ablation of LFABP or IFABP induced marked changes in the gut microbiota, and these were associated with HFD-induced phenotypic changes in these mice.
Keywords: gut microbiota; intestinal fatty acid-binding protein; liver fatty acid-binding protein.
Conflict of interest statement
L.Z. is a co-founder of Notitia Biotechnologies Company. Y.Y.L. is an employee of Hong Kong Baptist University and an academic staff seconded to the Centre for Chinese Herbal Medicine Drug Development (CDD) for conducting academic research. CDD is a company 100% owned by Hong Kong Baptist University and is hosted by its School of Chinese Medicine.
Figures
Similar articles
-
The proximal intestinal Fatty Acid-Binding Proteins liver FABP (LFABP) and intestinal FABP (IFABP) differentially modulate whole body energy homeostasis but are not centrally involved in net dietary lipid absorption: Studies of the LFABP/IFABP double knockout mouse.Biochim Biophys Acta Mol Cell Biol Lipids. 2023 Jan;1868(1):159238. doi: 10.1016/j.bbalip.2022.159238. Epub 2022 Oct 4. Biochim Biophys Acta Mol Cell Biol Lipids. 2023. PMID: 36206853 Free PMC article.
-
Direct comparison of mice null for liver or intestinal fatty acid-binding proteins reveals highly divergent phenotypic responses to high fat feeding.J Biol Chem. 2013 Oct 18;288(42):30330-30344. doi: 10.1074/jbc.M113.501676. Epub 2013 Aug 29. J Biol Chem. 2013. PMID: 23990461 Free PMC article.
-
Mechanisms underlying reduced weight gain in intestinal fatty acid-binding protein (IFABP) null mice.Am J Physiol Gastrointest Liver Physiol. 2020 Mar 1;318(3):G518-G530. doi: 10.1152/ajpgi.00120.2019. Epub 2020 Jan 6. Am J Physiol Gastrointest Liver Physiol. 2020. PMID: 31905021 Free PMC article.
-
A High-Fat Diet Increases Gut Microbiota Biodiversity and Energy Expenditure Due to Nutrient Difference.Nutrients. 2020 Oct 20;12(10):3197. doi: 10.3390/nu12103197. Nutrients. 2020. PMID: 33092019 Free PMC article.
-
Enterocyte fatty acid-binding proteins (FABPs): different functions of liver and intestinal FABPs in the intestine.Prostaglandins Leukot Essent Fatty Acids. 2015 Feb;93:9-16. doi: 10.1016/j.plefa.2014.10.001. Epub 2014 Oct 14. Prostaglandins Leukot Essent Fatty Acids. 2015. PMID: 25458898 Free PMC article. Review.
Cited by
-
The Multifunctional Family of Mammalian Fatty Acid-Binding Proteins.Annu Rev Nutr. 2023 Aug 21;43:25-54. doi: 10.1146/annurev-nutr-062220-112240. Epub 2023 May 19. Annu Rev Nutr. 2023. PMID: 37207357 Free PMC article. Review.
-
Tissue-Specific Ablation of Liver Fatty Acid-Binding Protein Induces a Metabolically Healthy Obese Phenotype in Female Mice.Nutrients. 2025 Feb 21;17(5):753. doi: 10.3390/nu17050753. Nutrients. 2025. PMID: 40077623 Free PMC article.
-
Novel Hyperplastic Expansion of White Adipose Tissue Underlies the Metabolically Healthy Obese Phenotype of Male LFABP Null Mice.Cells. 2025 May 22;14(11):760. doi: 10.3390/cells14110760. Cells. 2025. PMID: 40497936 Free PMC article.
-
Tissue-Specific Ablation of Liver Fatty Acid-Binding Protein Induces a Metabolically Healthy Obese Phenotype in Female Mice.bioRxiv [Preprint]. 2025 Jan 2:2025.01.02.631082. doi: 10.1101/2025.01.02.631082. bioRxiv. 2025. Update in: Nutrients. 2025 Feb 21;17(5):753. doi: 10.3390/nu17050753. PMID: 39803463 Free PMC article. Updated. Preprint.
-
Intestinal Barrier Dysfunction and Gut Microbiota in Non-Alcoholic Fatty Liver Disease: Assessment, Mechanisms, and Therapeutic Considerations.Biology (Basel). 2024 Apr 6;13(4):243. doi: 10.3390/biology13040243. Biology (Basel). 2024. PMID: 38666855 Free PMC article. Review.
References
MeSH terms
Substances
Grants and funding
LinkOut - more resources
Full Text Sources
Research Materials
