. 2022 Apr 24;14(9):1782.
doi: 10.3390/nu14091782.

Changing Dietary Habits: The Impact of Urbanization and Rising Socio-Economic Status in Families from Burkina Faso in Sub-Saharan Africa

Affiliations

Changing Dietary Habits: The Impact of Urbanization and Rising Socio-Economic Status in Families from Burkina Faso in Sub-Saharan Africa

Silene Casari et al. Nutrients. .

Abstract

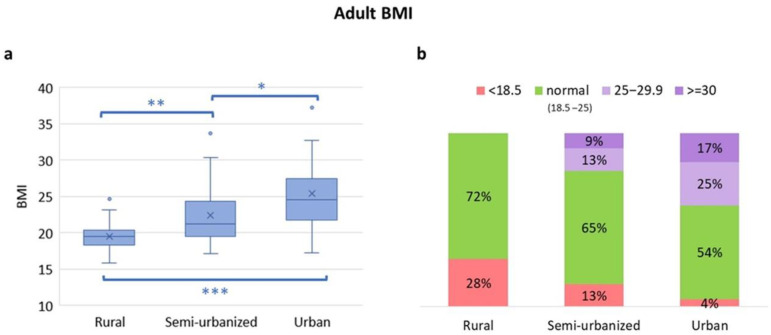
(1) Background: Sub-Saharan Africa is experiencing the fastest urbanization worldwide. People in rural areas still have a traditional and rural lifestyle, whereas the Westernization of diet and lifestyle is already evident in urban areas. This study describes dietary habits of families in Burkina Faso living at different levels of urbanization. (2) Methods: Data on lifestyle, socio-economic conditions, health status and anthropometry were collected from 30 families living in rural villages, a small town and the capital city. A food frequency questionnaire and a 24 h recall diary were used to estimate dietary habits and macronutrients intake. (3) Results: The urban cohort showed a more diversified diet, with a higher intake of animal protein and, especially in children, a higher consumption of simple sugars. Fiber intake was significantly higher in the rural and semi-urbanized cohorts. As expected, overweight and obesity gradually increased with the level of urbanization. In semi-urbanized and urban families, we observed coexistence of under- and over-nutrition, whereas in rural families, a portion of children were wasted and stunted, and adults were underweight. (4) Conclusions: These three cohorts represent a model of the effect on diet of rural-to-urban migration. Rural diet and traditional habits are replaced by a Western-oriented diet when families move to urbanized areas. This dietary transition and increased socio-economic status in newly developing urban areas have a major impact on disease epidemiology, resembling the past evolution in Western countries.

Keywords: Burkina Faso; Western diet; fiber intake; rural diet; sub-Saharan Africa; urbanization.


Conflict of interest statement

The authors declare no conflict of interest.

Figures

Figure 1
Figure 1
Map of Burkina Faso and areas of the three enrolled cohorts. (a) In blue: Urban area of the capital city Ouagadougou; in yellow: The small town of Nanoro (initial level of urbanization); in red: Rural area. (b) Detailed map. In red, the three rural villages of Boulpon, Godo and Poessi; in yellow, the town of Nanoro.
Figure 2
Figure 2
Life in Burkina Faso. (a) Rural village (Boulpon), (b) semi-urbanized area (Nanoro town), (c) the capital city Ouagadougou. Personal photographs taken by Paolo Lionetti and Silene Casari.
Figure 3
Figure 3
Macronutrient intake in adults and children in the rural, semi-urban and urban areas. The box plots represent median with interquartile range. Total proteins expressed as percentage of total caloric intake in adults (a) and children (b). Animal proteins as percentage of total proteins in adults (c) and children (d). Simple sugars expressed as percentage of total caloric intake in adults (e) and children (f). Fiber intake expressed as grams per 1000 kcal in adults (g) and children (h). Statistically significant by Mann–Whitney test *** p ≤ 0.001, ** p ≤ 0.01, * p ≤ 0.05.
Figure 4
Figure 4
Weekly frequency of food consumption. The frequency of consumption of the categorized food items was referred to the seven days prior to the interview. Data are referred to all the enrolled individuals, without distinction of age. R = rural; SU = semi-urbanized; U = urban cohorts. Percentages may not add up to exactly 100% due to rounding. Right panel: Table of the total protein sources showing the proportion of individuals from the three cohorts that consume food rich in proteins (such as meat, fish, egg, cheese, dairy and legumes). Similarly, table of fruit and vegetables showing the proportion of individuals consuming weekly both fruits and vegetables; table of total carbohydrate sources showing the proportion of individuals consuming weekly foods rich in carbohydrates (such as bread, rice, to, pasta and potatoes); table of sweet food showing the proportion of individuals consuming weekly foods rich in simple sugars.
Figure 5
Figure 5
Dietary diversity score (DDS). The box plots show the median and interquartile range (IQR). “x” is the mean and blue dots are outliers. *** p < 0.001 ** p < 0.01 (Mann–Whitney test).
Figure 6
Figure 6
Comparison of the BMI categories among adults from rural, semi-urban and urban areas. (a) BMI distribution. Boxplots show median and interquartile range. “x” is the mean and blue dots are outliers. Statistically significant by Mann–Whitney test *** p ≤ 0.001, ** p ≤ 0.01, * p ≤ 0.05. (b) Proportion of adults with underweight (BMI < 18.5 kg/m2), normal weight (BMI 18.5–25 kg/m2), overweight (BMI 25–29.9 kg/m2) and obesity (>30 kg/m2) across the areas.
Figure 7
Figure 7
Comparison of BMI categories among children from the rural, semi-urban and urban areas. (a) BMI by age group, boxplots show median and interquartile range (IQR). “x” is the mean and blue dots are outliers (b) BMI distribution. BMI < −2 SD defines acute malnutrition; <−3 SD severe acute malnutrition. For children < 5 years, SD of weight-for-height was considered instead of BMI. (c) Prevalence of stunting among children; <−2 SD as moderate stunting, <−3 SD as severe stunting. yrs, years old.
Figure 8
Figure 8
Double burden of malnutrition. Distribution of different forms of malnutrition (under- or overweight) within families. The number of households with at least one family member affected by underweight, stunting or overweight was reported.

References

    1. Baker P., Machado P., Santos T., Sievert K., Backholer K., Hadjikakou M., Russell C., Huse O., Bell C., Scrinis G., et al. Ultra-processed foods and the nutrition transition: Global, regional and national trends, food systems transformations and political economy drivers. Obes. Rev. 2020;21:e13126. doi: 10.1111/obr.13126. - DOI - PubMed
    1. Drewnowski A., Popkin B.M. The nutrition transition: New trends in the global diet. Nutr. Rev. 1997;55:31–43. doi: 10.1111/j.1753-4887.1997.tb01593.x. - DOI - PubMed
    1. Popkin B.M. The nutrition transition: An overview of world patterns of change. Nutr. Rev. 2004;62:S140–S143. doi: 10.1111/j.1753-4887.2004.tb00084.x. - DOI - PubMed
    1. Kennedy G., Nantel G., Shetty P. Food and Agriculture Organization of the United Nations Globalization of food systems in developing countries: Impact on food security and nutrition. FAO Food Nutr. Pap. 2004;83:1–300. - PubMed
    1. Ruel M.T., Garrett J.L. Features of Urban Food and Nutrition Security and Considerations for Successful Urban Programming. Electron. J. Agric. Dev. Econ. 2004;1:242–271.