. 2022 Apr 25;14(9):1794.
doi: 10.3390/nu14091794.

Effect of Extract-Added Water Derived from Deep-Sea Water with Different Hardness on Cognitive Function, Motor Ability and Serum Indexes of Obese Mice

Affiliations

Effect of Extract-Added Water Derived from Deep-Sea Water with Different Hardness on Cognitive Function, Motor Ability and Serum Indexes of Obese Mice

Koji Fukui et al. Nutrients. .

Abstract

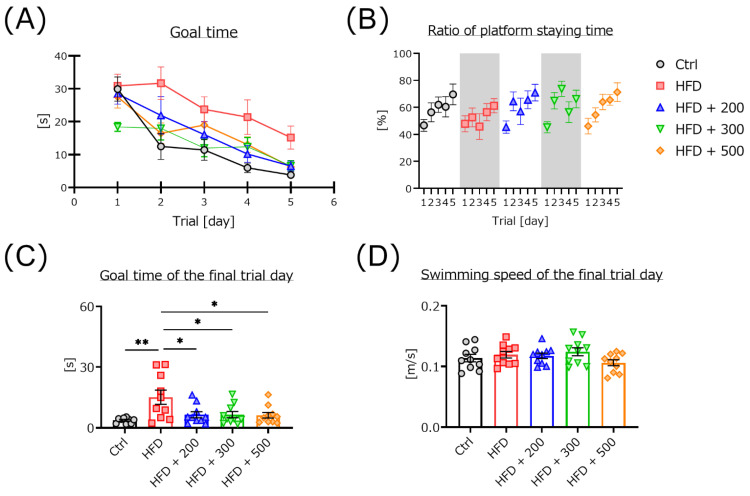
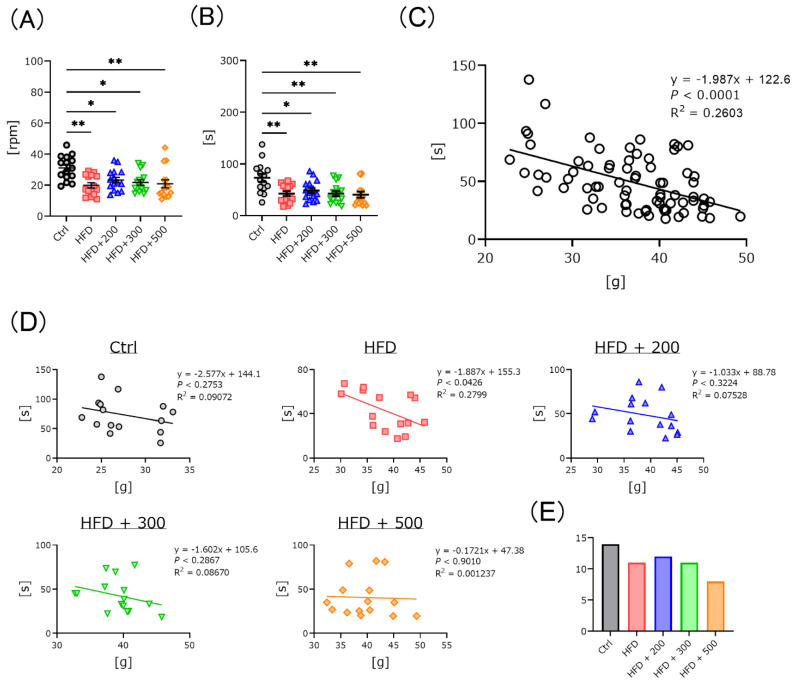
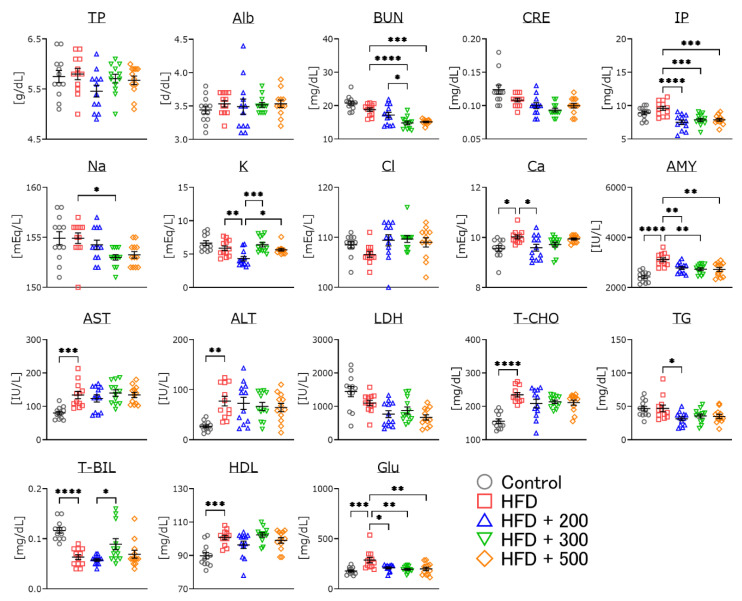
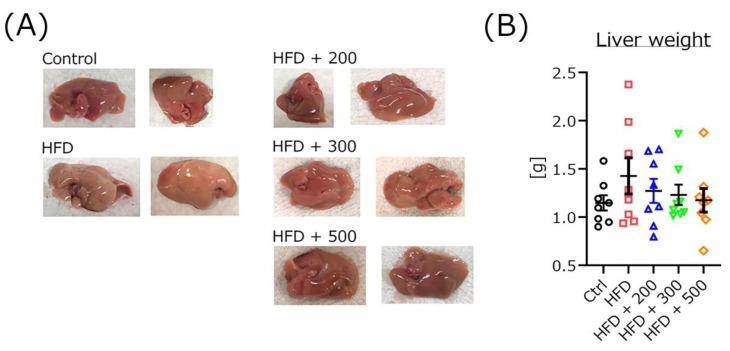
Deep-sea water (DSW) contains multiple minerals and is widely used as drinking water, for cosmetic purposes, and as seasoning. In this study, several types of extract-added water with different levels of hardness (200, 300, 500) were prepared from DSW collected off the coast of Muroto City, Kochi Prefecture. We administrated it to obese mice for two months and tested it for several effects. Although there was no anti-obesity effect for any hardness level in obese mice, the cognitive functions of each DSW-extract-added water-treated group were significantly improved compared to control obese mice in the water maze test. Time-to-fall by the rota-rod test was also dramatically improved in the DSW-extract-added water-treated groups. The levels of triglycerides and blood urea nitrogen were significantly decreased in DSW-extract-added water-treated obese mice. However, these results did not depend on the hardness. Hardness levels of 200 or 300 of DSW-extract-added water had greater effects on cognitive function and serum scores compared to a level of 500. We analyzed DSW using inductively coupled plasma atomic emission spectroscopy and inductively coupled plasma mass spectrometry. High concentrations of magnesium and potassium were detected, but sodium was not detected at very high concentrations. Although the detailed mechanisms of its effects are not yet understood, chronic intake of DSW-extract-added water may have a beneficial effect on health.

Keywords: cognition; deep-sea water; different hardness; motor ability; obese mice.


Conflict of interest statement

The authors declare no conflict of interest.

Figures

Figure 1
Figure 1
Differences in cognitive function between control, HFD-treated, and HFD plus DSW-extract-added water-treated mice. The time to goal (escape latency) in the Morris water maze test is shown in panel (A). The ratio of staying time in the platform quadrant is shown in panel (B). The average goal times of the final trial day are shown in panel (C). The average swimming speed on the final trial day is shown in panel (D). Control (Ctrl, n = 10), high-fat diet (HFD, n = 10), HFD + DSW-extract-added water hardness 200 (HFD + 200, n = 10), HFD + DSW-extract-added water hardness 300 (HFD + 300, n = 10), HFD + DSW-extract-added water hardness 500 (HFD + 500, n = 10). * p < 0.05, ** p < 0.01. The data are shown as means ± SE. Statistical analyses of the goal time were performed using two-way analysis of variance. Statistical analyses of the goal time for each day, swimming speed, and the ratio of staying time in the platform quadrant were performed using the Tukey-Kramer method.
Figure 2
Figure 2
Time to fall in the rota-rod test. The fall speed and fall time are shown in panels (A) and (B). The relationship between weight and time to fall from the rod for all mice is shown in panel (C). The relationship between weight and time to fall from the rod for each mouse group is shown in panel (D). Panel (E) shows the number of mice that have remained on the rod for more than 30 s. Control (Ctrl, n = 15), high fat diet (HFD, n = 15), HFD + DSW-extract-added water hardness 200 (HFD + 200, n = 15), HFD + DSW-extract-added water hardness 300 (HFD + 300, n = 15), HFD + DSW-extract-added water hardness 500 (HFD + 500, n = 15). * p < 0.05, ** p < 0.01. The data are shown as means ± SE. Statistical analysis of data in panels A and B was performed using the Tukey-Kramer method. Those for panels (C) and (D) were performed using simple regression analysis.
Figure 3
Figure 3
Total arm entries (A) and alternation scores (B) were measured using the Y-maze test. Control (Ctrl, n = 15), high-fat diet (HFD, n = 15), HFD + DSW-extract-added water hardness 200 (HFD + 200, n = 15), HFD + DSW-extract-added water hardness 300 (HFD + 300, n = 15), HFD + DSW-extract-added water hardness 500 (HFD + 500, n = 15). The data are shown as means ± SE. Comparisons were performed using the Tukey-Kramer method.
Figure 4
Figure 4
Western blotting analysis of the levels of neurotrophic factor-related proteins in the brains of control, HFD-treated, and HFD plus DSW-extract-added water-treated mice. All experiments were performed using cortex and hippocampal regions. The ratio of each protein band intensity to Ponceau S intensity is shown, with ratios of control samples set to 1 (A). Control (Ctrl, n = 10), high-fat diet (HFD, n = 10), HFD + DSW-extract-added water hardness 200 (HFD + 200, n = 10), HFD + DSW-extract-added water hardness-300 (HFD + 300, n = 10), HFD + DSW-extract-added water hardness 500 (HFD + 500, n = 10). * p < 0.05, *** p < 0.001. The data are shown as means ± SE. Comparisons were performed using the Tukey-Kramer method. Representative western blotting images (B).
Figure 5
Figure 5
Changes in serum parameters for control, HFD-treated and HFD-plus DSW-extract-added water-treated mice. Control (Ctrl, n = 12), high fat diet (HFD, n = 12), HFD + DSW-extract-added water hardness 200 (HFD + 200, n = 12), HFD + DSW-extract-added water hardness 300 (HFD + 300, n = 12), HFD + DSW-extract-added water hardness 500 (HFD + 500, n = 12). The data are shown as means ± SE. * p < 0.05, ** p < 0.01, *** p < 0.001, **** p < 0.0001. Comparisons were performed using the Tukey-Kramer method. TP, total protein; Alb, albumin; BUN, blood urea nitrogen; CRE, creatinine; IP, inorganic phosphorus; Na, sodium; K, potassium; Cl, chlorine; Ca, calcium; AMY, amylase; AST, aspartate aminotransferase; ALT, alanine aminotransferase; LDH, lactic acid dehydrogenase; T-CHO, total cholesterol; TG, triglyceride; T-BIL, total bile acid; HDL, high density lipoprotein; Glu, glucose.
Figure 6
Figure 6
Livers removed after treatment. Liver images (A). Control (Ctrl), high-fat diet (HFD), HFD + DSW-extract-added water hardness 200 (HFD + 200), HFD + DSW-extract-added water hardness 300 (HFD + 300), HFD + DSW-extract-added water hardness 500 (HFD + 500). The liver weight of each mouse group (B). (n = 8, respectively) There were no significant differences among all groups. The data are shown as means ± SE. Comparisons were performed using the Tukey-Kramer method.

Similar articles

Cited by

References

    1. Colotti G., Ilari A., Boffi A., Morea V. Metals and metal derives in medicine. Mini-Rev. Med. Chem. 2013;13:211–221. - PubMed
    1. Kacar B., Garcia A.K., Anbar A.D. Evolutionary history of bioessential elements can guide the search for life in the universe. Chembiochem. 2021;22:114–119. doi: 10.1002/cbic.202000500. - DOI - PubMed
    1. Biochemistry, Nutrients. [(accessed on 21 December 2021)]; Available online: https://www.ncbi.nlm.nih.gov/books/NBK554545/
    1. Zoroddu M.A., Aaseth J., Crisponi G., Medici S., Peana M., Nurchi V.M. The essential metals for humans: A brief overview. J. Inorg. Biochem. 2019;195:120–129. doi: 10.1016/j.jinorgbio.2019.03.013. - DOI - PubMed
    1. Mertz W. The essential trace elements. Science. 1981;213:1332–1338. doi: 10.1126/science.7022654. - DOI - PubMed

LinkOut - more resources