. 2022 Apr 27;14(9):1834.
doi: 10.3390/nu14091834.

Grape Seed Proanthocyanidins Mitigate the Disturbances Caused by an Abrupt Photoperiod Change in Healthy and Obese Rats

Affiliations

Grape Seed Proanthocyanidins Mitigate the Disturbances Caused by an Abrupt Photoperiod Change in Healthy and Obese Rats

Jorge R Soliz-Rueda et al. Nutrients. .

Abstract

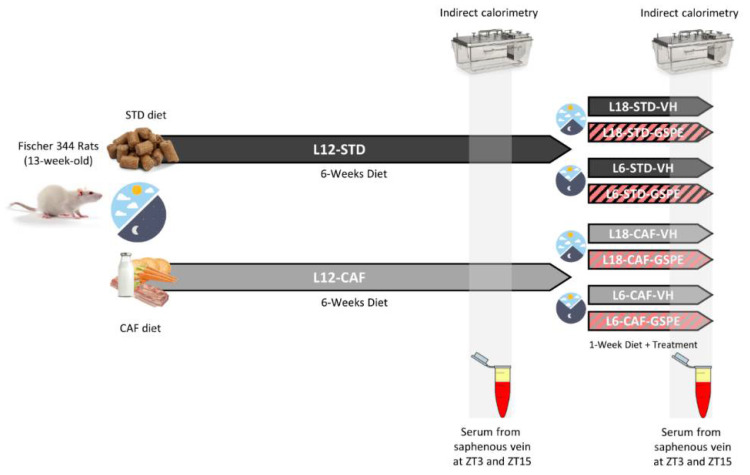
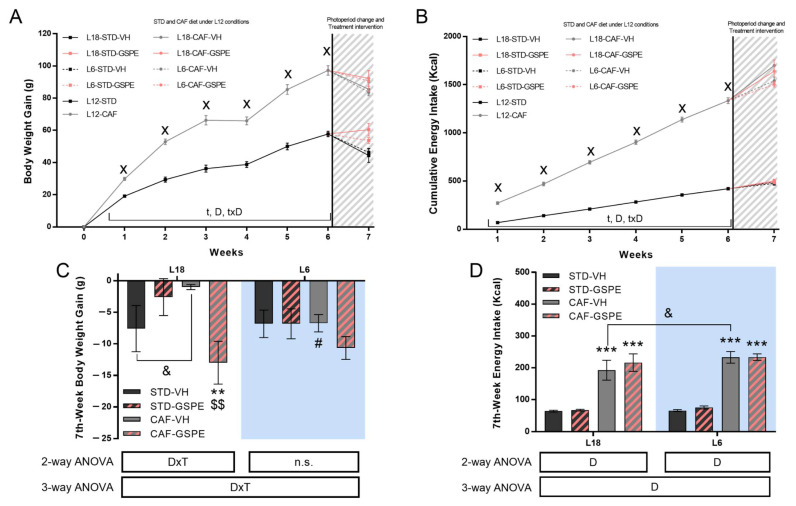
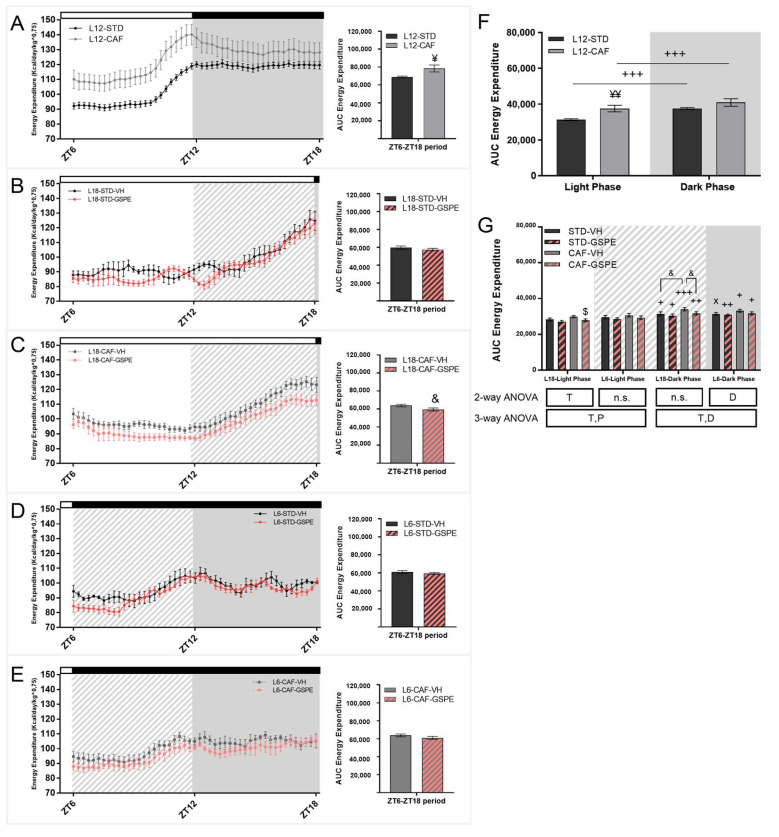
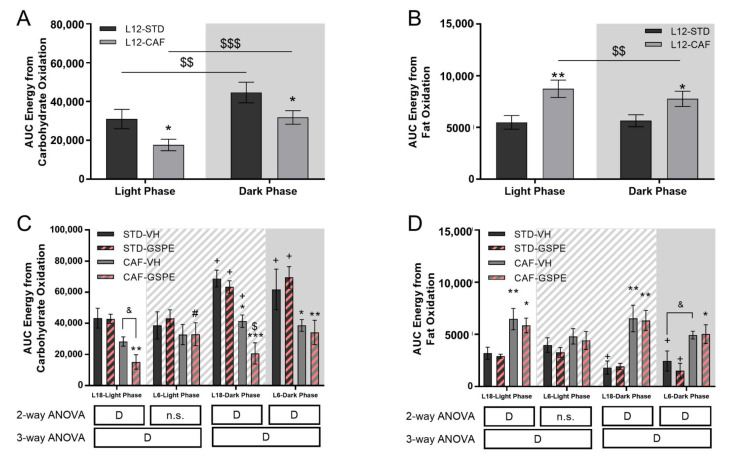
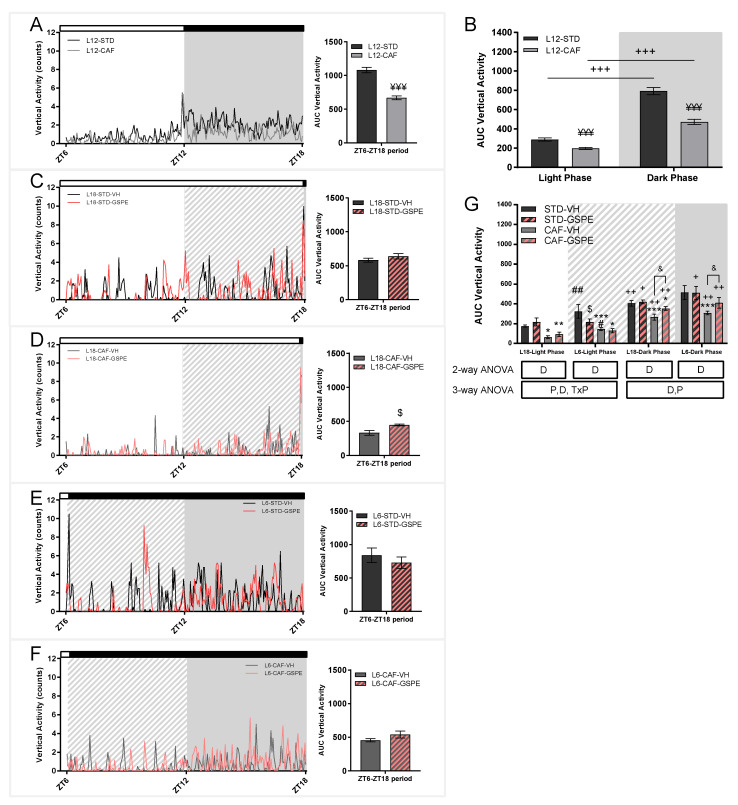
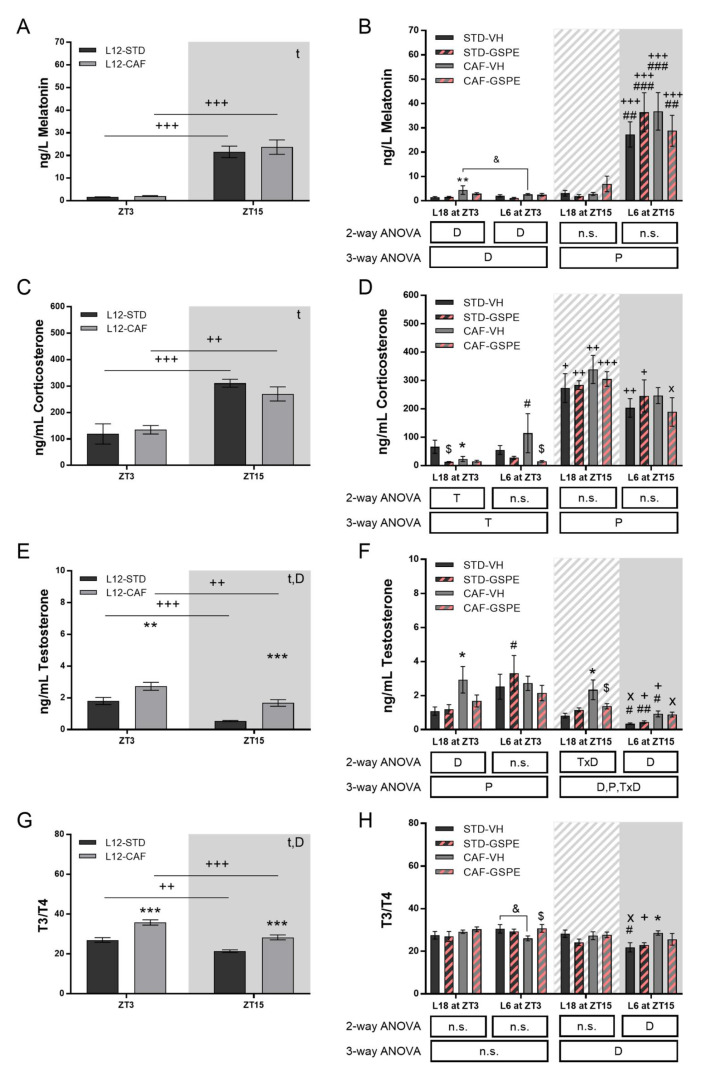
Variations in the light/dark cycle and obesogenic diets trigger physiological and behavioral disorders. Proanthocyanidins, in addition to their healthy properties, have recently demonstrated a modulating effect on biological rhythms. Therefore, the aim of this study was to evaluate the administration of a grape seed proanthocyanidin-rich extract (GSPE) to mitigate the disruption caused by a sudden photoperiod change in healthy and cafeteria (CAF)-diet obese rats. For this, 48 photoperiod-sensitive Fischer 344 rats were fed standard or CAF diets for 6 weeks under a standard (12 h light/day, L12) conditions. Then, rats were switched to a long (18 h light/day, L18) or short (6 h light/day, L6) photoperiod and administered vehicle or GSPE (25 mg/kg) for 1 week. Body weight (BW) and food intake (FI) were recorded weekly. Animal activity and serum hormone concentrations were studied before and after the photoperiod change. Hormone levels were measured both at 3 h (ZT3) and 15 h (ZT15) after the onset of light. Results showed the impact of the CAF diet and photoperiod on the BW, FI, activity, and hormonal status of the animals. GSPE administration resulted in an attenuation of the changes produced by the photoperiod disruption. Specifically, GSPE in L6 CAF-fed rats reduced serum corticosterone concentration, restoring its circadian rhythm, increased the T3-to-T4 ratio, and increased light phase activity, while under L18, it decreased BW and testosterone concentration and increased the animal activity. These results suggest that GSPE may contribute to the adaptation to the new photoperiods. However, further studies are needed to elucidate the metabolic pathways and processes involved in these events.

Keywords: cafeteria diet; chrono nutrition; circadian rhythms; phenolic compounds; seasonal rhythms; zeitgebers.


Conflict of interest statement

The authors declare no conflict of interest. The funders had no role in the design of the study; in the collection, analyses, or interpretation of data; in the writing of the manuscript, or in the decision to publish the results.

Figures

Figure 1
Figure 1
Experimental design to evaluate the effect of GSPE after an abrupt disturbance of the photoperiod. STD- and CAF-fed rats were switched to a new light–dark cycle and VH or GSPE were administered to the animals. STD, Standard diet-fed rats; CAF, Cafeteria diet-fed rats; VH, rats administered vehicle; GSPE, rats administered 25 mg/kg grape seed proanthocyanidin-rich extract; L12, standard photoperiod 12 h light per day; L18, long photoperiod 18 h light per day; L6, short photoperiod 6 h light per day.
Figure 2
Figure 2
Body weight gain and cumulative food intake. (A) Body weight gain and (B) Cumulative energy intake over the experiment. (C) Body weight gain in the seventh week for L18 and L6 conditions and (D) Cumulative energy intake for L18 and L6 conditions (STD-VH, STD-GSPE, CAF-VH, and CAF-GSPE) in the seventh week. Values are expressed as the mean ± S.E.M. (n = 24 for L12 groups and n = 6 for L18 and L6 groups). x Indicates significant differences using repeated measured-ANOVA followed by a Student’s t-test between L12-STD vs. L12-CAF (p ≤ 0.001). D, diet effect; DxT, interaction between treatment and Diet; t, time effect; txD, interaction between time and diet effect. n.s., no significant differences. ** or *** Indicate significant differences by diet effect (p ≤ 0.01 and p ≤ 0.001, respectively), $$ Indicates significant differences by treatment effect (p ≤ 0.01), # Indicates significant differences by photoperiod effect using 2-way and 3-way ANOVA followed by a LSD post-hoc test (p ≤ 0.05). & Indicates tendency using a LSD post-hoc test (p = 0.1–0.051). STD, Standard diet-fed rats; CAF, Cafeteria diet-fed rats; VH, rats administered vehicle; GSPE, rats administered 25 mg/kg grape seed proanthocyanidin-rich extract; L12, standard photoperiod 12 h light per day; L18, long photoperiod 18 h light per day; L6, short photoperiod 6 h light per day. The blue background corresponds to the groups under L6 conditions.
Figure 3
Figure 3
Energy expenditure of STD- and CAF-fed rats in the sixth week of the experiment under L12 conditions and in the seventh week of the experiment under L18 and L6 conditions. (A) EE for STD- and CAF-fed rats under the L12 photoperiod and the corresponding AUC. (B) EE for STD-fed rats and VH or GSPE administration under the L18 photoperiod and AUC. (C) EE for CAF-fed rats administered VH or GSPE under the L18 photoperiod and the corresponding AUC. (D) EE for STD-fed rats administered VH or GSPE under the L6 photoperiod and the corresponding AUC. (E) EE for CAF-fed rats administered VH or GSPE under the L6 photoperiod and the corresponding AUC. (F) AUC of EE for L12 conditions groups. (G) AUC of EE for L6 and L18 conditions groups. For L12 conditions values are expressed as the mean ± S.E.M. (n = 24). ¥ or ¥¥ Indicate significant differences using an unpaired Student’s t-test between L12-STD vs. L12-CAF (p ≤ 0.05 and p ≤ 0.01, respectively). Values are expressed as the mean ± S.E.M. (n = 6). D, diet effect; T, GSPE treatment effect; P, photoperiod effect; n.s., no significant differences. $ Indicates significant differences by treatment effect. & Indicates tendency using a LSD post-hoc test (p = 0.1–0.051). +, ++ or +++ Indicate significant differences using a paired Student’s t-test between Light Phase vs. Dark Phase for each group (p ≤ 0.05, p ≤ 0.01 and p ≤ 0.001, respectively). x Indicates tendency using a paired Student´s t-test between Light Phase vs. Dark Phase for each group (p = 0.1–0.051). EE, Energy Expenditure; AUC, Area under curve; STD, Standard diet-fed rats; CAF, Cafeteria diet-fed rats; VH, rats administered vehicle; GSPE, rats administered 25 mg/kg grape seed proanthocyanidin-rich extract; L12, standard photoperiod 12 h light per day; L18, long photoperiod 18 h light per day; L6, short photoperiod 6 h light per day. Grey background, dark phase. slash background, transitions phase.
Figure 4
Figure 4
Energy from carbohydrate or fat oxidation of STD- and CAF-fed rats in the sixth week of the experiment under L12 conditions and in the seventh week of the experiment under L18 and L6 conditions. (A) AUC of energy from carbohydrate oxidation for STD- and CAF-fed rats under the L12 photoperiod. (B) AUC of energy from fat oxidation for STD-fed rats and VH or GSPE administration under the L18 photoperiod. (C) AUC of energy from carbohydrate oxidation for L6 and L18 conditions groups. (D) AUC of energy from fat oxidation for L6 and L18 conditions groups. For L12 conditions, values are expressed as the mean ± S.E.M. (n = 24). Values are expressed as the mean ± S.E.M. (n = 6). D, diet effect; n.s., no significant differences. *, ** or *** Indicate significant differences by diet effect (p ≤ 0.05, p ≤ 0.01 and p ≤ 0.001, respectively), $, $$ or $$$ Indicate significant differences by treatment effect (p ≤ 0.05, p ≤ 0.01 and p ≤ 0.001, respectively), # Indicates significant differences by photoperiod effect using 2-way and 3-way ANOVA followed by a LSD post-hoc test (p ≤ 0.05). & Indicates tendency using a LSD post-hoc test (p = 0.1–0.051). + Indicate significant differences using a paired Student´s t-test between Light Phase vs. Dark Phase for each group (p ≤ 0.05, respectively). AUC, Area under curve; STD, Standard diet-fed rats; CAF, Cafeteria diet-fed rats; VH, rats administered vehicle; GSPE, rats administered 25 mg/kg grape seed proanthocyanidin-rich extract; L12, standard photoperiod 12 h light per day; L18, long photoperiod 18 h light per day; L6, short photoperiod 6 h light per day. Grey background, dark phase. slash background, transitions phase.
Figure 5
Figure 5
Activity of STD- and CAF-fed rats in the sixth week of the experiment under L12 conditions and in the seventh week of the experiment under L18 and L6 conditions. (A) Activity for STD- and CAF-fed rats under the L12 photoperiod and the corresponding AUC. (B) Activity for STD-fed rats administered VH or GSPE under the L18 photoperiod and the corresponding AUC. (C) Activity for CAF-fed rats administered VH or GSPE under the L18 photoperiod and the corresponding AUC. (D) Activity for STD-fed rats administered VH or GSPE under the L6 photoperiod and the corresponding AUC. (E) Activity for CAF-fed rats administered VH or GSPE under the L6 photoperiod and the corresponding AUC. (F) AUC of activity for L12 conditions groups with light phase and dark phase separated. (G) AUC activity for L6 and L18 conditions groups with light phase and dark phase separated. For L12 conditions, values are expressed as the mean ± S.E.M. (n = 24). ¥¥¥ Indicates significant differences using an unpaired Student´s t-test between L12-STD vs. L12-CAF (p ≤ 0.001). Values are expressed as the mean ± S.E.M. (n = 6). D, diet effect; P, photoperiod effect; TxP, interaction between treatment and photoperiod. *, ** or *** Indicate significant differences by diet effect (p ≤ 0.05, p ≤ 0.01 and p ≤ 0.001, respectively), $ Indicates significant differences by treatment effect, ## Indicate significant differences by photoperiod effect (p ≤ 0.01, respectively) using 2-way and 3-way ANOVA followed by a LSD post-hoc test (p ≤ 0.05). & Indicates tendency using a LSD post-hoc test (p = 0.1–0.051). +, ++ or +++ Indicate significant differences using a paired Student´s t-test between Light Phase vs. Dark Phase for each group (p ≤ 0.05, p ≤ 0.01 and p ≤ 0.001, respectively). AUC, Area under curve; STD, Standard diet-fed rats; CAF, Cafeteria diet-fed rats; VH, rats administered vehicle; GSPE, rats administered 25 mg/kg grape seed proanthocyanidin-rich extract; L12, standard photoperiod 12 h light per day; L18, long photoperiod 18 h light per day; L6, short photoperiod 6 h light per day. Grey background, dark phase. slash background, transitions phase.
Figure 6
Figure 6
Serum hormones of STD- and CAF-fed rats in the sixth week of the experiment under L12 conditions and in the seventh week of the experiment under L18 and L6 conditions. Serum melatonin at ZT3 and ZT15 (A) in L12 and (B) L18 and L6 conditions. Serum corticosterone at ZT3 and ZT15 (C) in L12 and (D) L18 and L6 conditions. Serum testosterone at ZT3 and ZT15 (E) in L12 and (F) L18 and L6 conditions. Serum T3-to-T4 ratio at ZT3 and ZT15 (G) in L12 and (H) L18 and L6 conditions. Values are expressed as the mean ± S.E.M. (n = 6). D, diet effect; T, GSPE treatment effect; P, photoperiod effect; TxD, interaction between treatment and diet; DxP, interaction between diet and photoperiod; n.s., no significant differences. *, ** or *** Indicate significant differences by diet effect (p ≤ 0.05, p ≤ 0.01 and p ≤ 0.001, respectively), $ Indicate significant differences by treatment effect (p ≤ 0.05, respectively), #, ## or ### Indicate significant differences by photoperiod effect (p ≤ 0.05, p ≤ 0.01 and p ≤ 0.001, respectively) using 2-way and 3-way ANOVA followed by a LSD post-hoc test (p ≤ 0.05). & Indicates tendency using a LSD post-hoc test (p = 0.1–0.051). +, ++ or +++ Indicate significant differences using a paired Student’s t-test between ZT3 vs. ZT15 for each group (p ≤ 0.05, p ≤ 0.01 and p ≤ 0.001, respectively). x Indicates tendency using a paired Student’s t-test between ZT3 vs. ZT15 for each group (p = 0.1–0.051). AUC, Area under curve; GSPE, grape seed proanthocyanidin-rich extract, STD, Standard diet-fed rats; CAF, Cafeteria diet-fed rats; VH, rats administered vehicle; GSPE, rats administered 25 mg/kg GSPE; L12, normal photoperiod 12 h light per day; L18, long photoperiod 18 h light per day; L6, short photoperiod 6 h light per day. Grey background, dark phase. slash background, transitions phase.

Similar articles

Cited by

References

    1. Young M., McGinnis G. Circadian regulation of metabolic homeostasis: Causes and consequences. Nat. Sci. Sleep. 2016;8:163–180. doi: 10.2147/NSS.S78946. - DOI - PMC - PubMed
    1. Reppert S.M., Weaver D.R. Coordination of circadian timing in mammals. Nature. 2002;418:935–941. doi: 10.1038/nature00965. - DOI - PubMed
    1. Levi F., Schibler U. Circadian Rhythms: Mechanisms and Therapeutic Implications. Annu. Rev. Pharmacol. Toxicol. 2007;47:593–628. doi: 10.1146/annurev.pharmtox.47.120505.105208. - DOI - PubMed
    1. Challet E. Circadian clocks, food intake, and metabolism. Prog. Mol. Biol. Transl. Sci. 2013;119:105–135. doi: 10.1016/b978-0-12-396971-2.00005-1. - DOI - PubMed
    1. Dibner C., Schibler U., Albrecht U. The mammalian circadian timing system: Organization and coordination of central and peripheral clocks. Annu. Rev. Physiol. 2010;72:517–549. doi: 10.1146/annurev-physiol-021909-135821. - DOI - PubMed

LinkOut - more resources