

Phase Angle and Handgrip Strength as a Predictor of Disease-Related Malnutrition in Admitted Patients: 12-Month Mortality
- PMID: 35565818
- PMCID: PMC9105999
- DOI: 10.3390/nu14091851
Phase Angle and Handgrip Strength as a Predictor of Disease-Related Malnutrition in Admitted Patients: 12-Month Mortality
Abstract
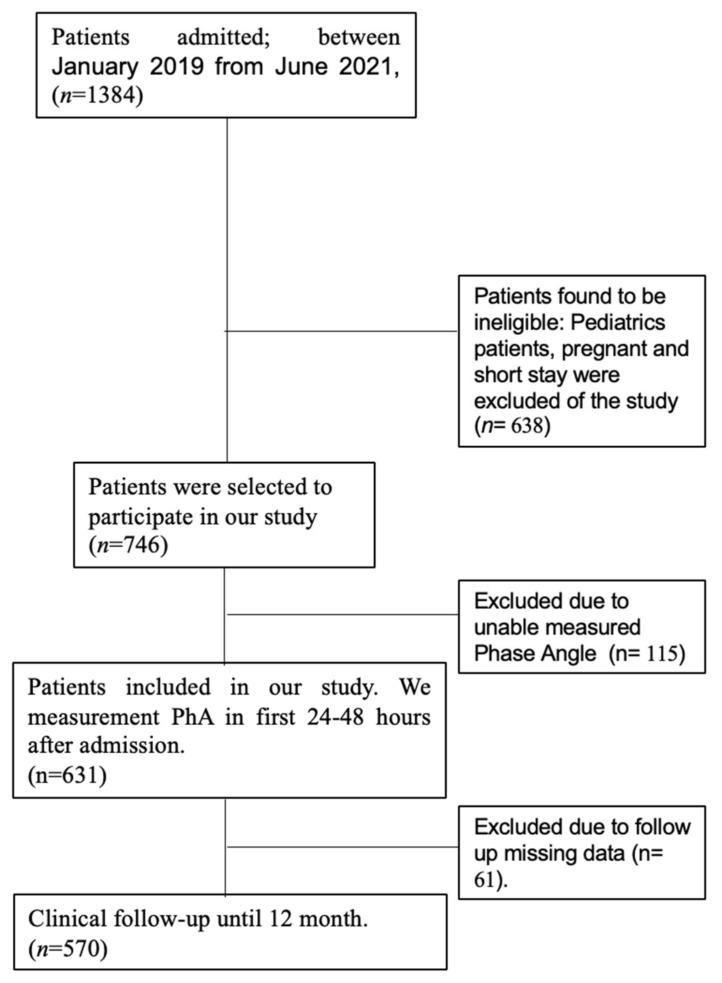
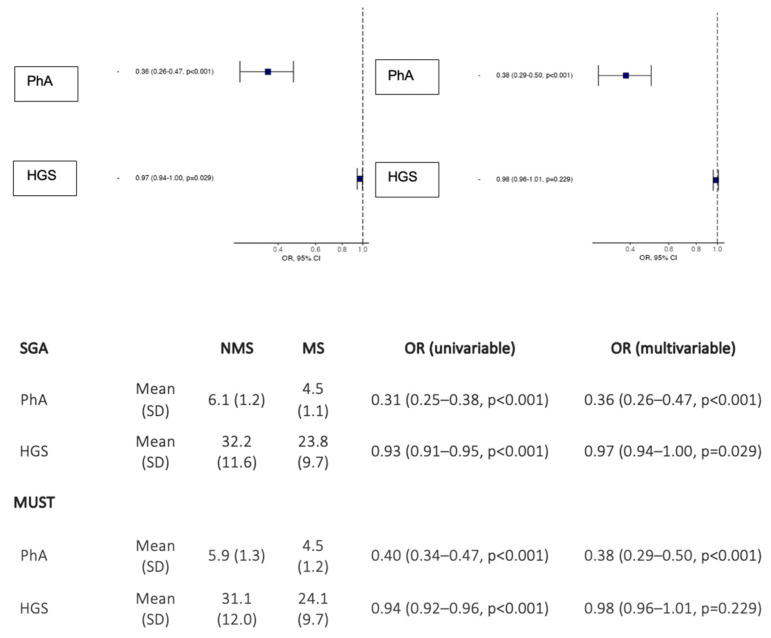
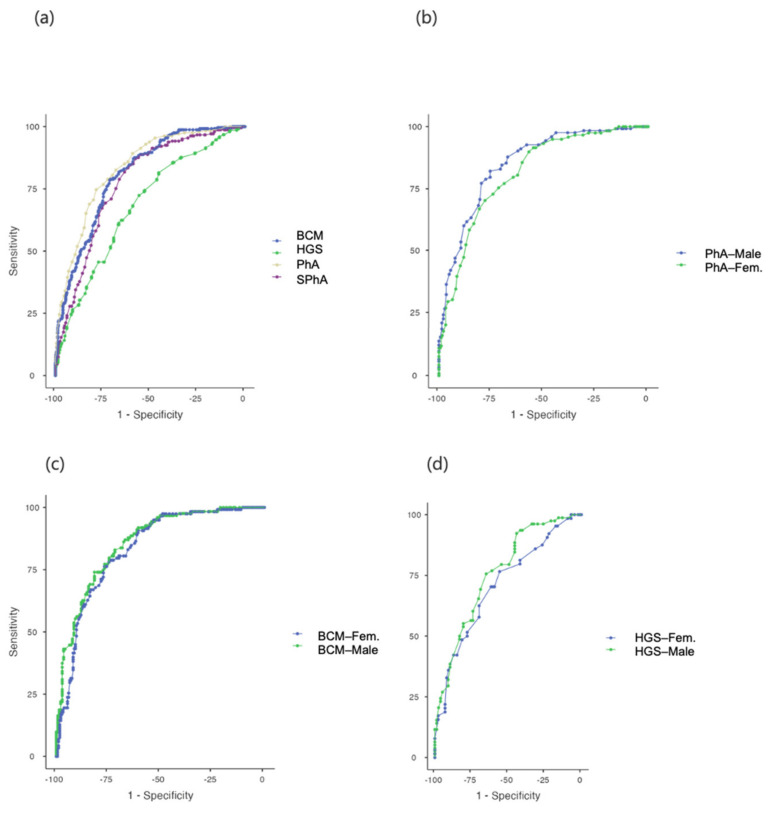
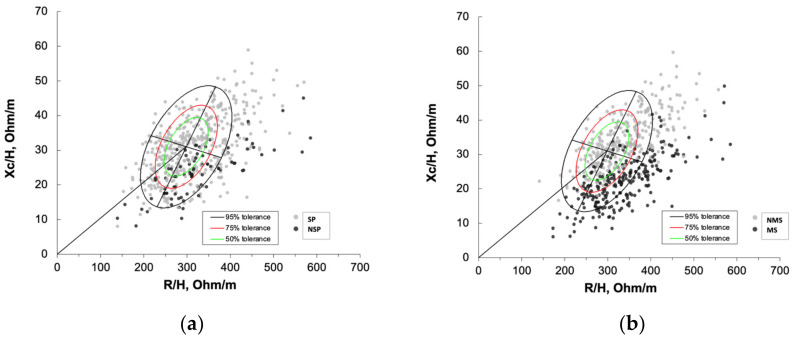
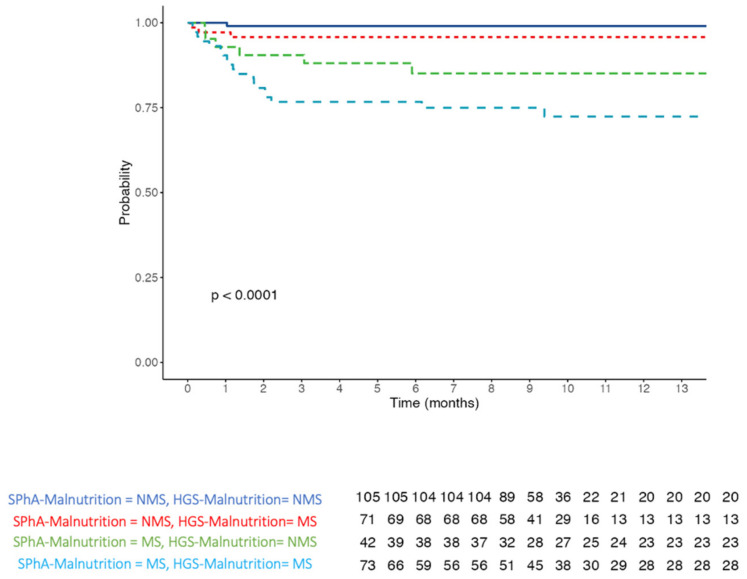
Background: Phase Angle (PhA) value measured by bioelectrical impedance analysis (BIA) could be considered a good marker of the patient’s cell mass and cellular damage. Various studies have shown that the value of PhA is associated with an increased nutritional risk in several pathologies. However, not many studies have focused on the use of PhA as a screening tool in admitted patients. The aim of this study is to evaluate the prognostic value of PhA to determine disease-related malnutrition (DRM) and the risk that this entails for mortality and length of stay (LOS). Methods: 570 patients admitted to the hospital for different causes were included in this retrospective observational study. Patients’ nutritional risk was assessed by screening tests such as the Malnutrition Universal Screening tool (MUST) and Subjective Global Assessment (SGA), in addition to non-invasive functional techniques, such as BIA and handgrip strength (HGS), 24−48 h after admission. After performing an SGA as the gold standard to assess malnutrition, PhA and SPhA values were used to determine DRM. Furthermore, both samples: malnutrition status (MS) and non-malnutrition status (NMS) were compared, with SphA-Malnutrition corresponding to a diagnosis of malnutrition. Statistical analysis of the sample was conducted with JAMOVI version 2.2.2. Results: Patients with MS had lower PhA and SPhA than patients with NMS (p < 0.001). The ROC curve analysis (AUC = 0.81) showed a cut-off point for MS for PhA = 5.4° (sensitivity 77.51% and specificity 74.07%) and AUC = 0.776 with a cut-off point for SPhA = −0.3 (sensitivity 81.74% and specificity 63.53%). Handgrip strength (HGS) was also observed to be a good predictor in hospitalized patients. Carrying out a comparative analysis between MS and NMS, length of stay (LOS) was 9.0 days in MS vs. 5.0 days in NMS patients (OR 1.07 (1.04−1.09, p < 0.001)). A low SPhA-malnutrition value (SPhA < −0.3) was significantly associated with a higher mortality hazards ratio (HR 7.87, 95% CI 2.56−24.24, p < 0.001). Conclusion: PhA, SPhA and HGS are shown to be good prognostic markers of DRM, LOS and mortality and could therefore be useful screening tools to complement the nutritional assessment of admitted patients.
Keywords: admitted patient; assessment tools; malnutrition; mortality; phase angle.
Conflict of interest statement
The authors declare no conflict of interest.
Figures
Similar articles
-
Rectus Femoris Cross-Sectional Area and Phase Angle asPredictors of 12-Month Mortality in Idiopathic Pulmonary Fibrosis Patients.Nutrients. 2023 Oct 22;15(20):4473. doi: 10.3390/nu15204473. Nutrients. 2023. PMID: 37892547 Free PMC article.
-
Phase angle assessment by bioelectrical impedance analysis and its predictive value for malnutrition risk in hospitalized geriatric patients.Aging Clin Exp Res. 2016 Dec;28(6):1121-1126. doi: 10.1007/s40520-015-0528-8. Epub 2016 Jan 19. Aging Clin Exp Res. 2016. PMID: 26786583
-
Can phase angle determined by bioelectrical impedance analysis assess nutritional risk? A comparison between healthy and hospitalized subjects.Clin Nutr. 2012 Dec;31(6):875-81. doi: 10.1016/j.clnu.2012.04.002. Epub 2012 May 4. Clin Nutr. 2012. PMID: 22560739
-
Bioelectrical impedance analysis (BIA) phase angle in stroke patients: A systematic review.Clin Nutr. 2024 Dec;43(12):63-72. doi: 10.1016/j.clnu.2024.10.001. Epub 2024 Oct 11. Clin Nutr. 2024. PMID: 39426214
-
Phase angle as a marker of muscle quality: A systematic review and meta-analysis.Clin Nutr. 2024 Dec;43(12):308-326. doi: 10.1016/j.clnu.2024.11.008. Epub 2024 Nov 9. Clin Nutr. 2024. PMID: 39549478
Cited by
-
Role of Bioimpedance Phase Angle and Hand Grip Strength in Predicting 12-Month Mortality in Patients Admitted with Haematologic Cancer.Cancers (Basel). 2025 Mar 5;17(5):886. doi: 10.3390/cancers17050886. Cancers (Basel). 2025. PMID: 40075733 Free PMC article.
-
Association between phase angle and all-cause mortality in adults aged 18-49 years: NHANES 1999-2004.Sci Rep. 2025 Jan 22;15(1):2785. doi: 10.1038/s41598-025-86825-y. Sci Rep. 2025. PMID: 39843978 Free PMC article.
-
Association between phase angle and the nutritional status in pediatric populations: a systematic review.Front Nutr. 2023 Jun 21;10:1142545. doi: 10.3389/fnut.2023.1142545. eCollection 2023. Front Nutr. 2023. PMID: 37415913 Free PMC article.
-
Protocol for a prospective cohort study on the feasibility of application of nutritional ultrasound in the diagnosis and follow-up of patients with nutritional risk at hospital discharge: study on body composition and function (DRECO).BMJ Open. 2023 Dec 9;13(12):e074945. doi: 10.1136/bmjopen-2023-074945. BMJ Open. 2023. PMID: 38070895 Free PMC article.
-
Phase Angle as a Potential Screening Tool in Adults with Metabolic Diseases in Clinical Practice: A Systematic Review.Int J Environ Res Public Health. 2023 Jan 16;20(2):1608. doi: 10.3390/ijerph20021608. Int J Environ Res Public Health. 2023. PMID: 36674360 Free PMC article.
References
-
- Agarwal E., Ferguson M., Banks M., Batterham M., Bauer J., Capra S., Isenring E. Malnutrition and poor food intake are associated with prolonged hospital stay, frequent readmissions, and greater in-hospital mortality: Results from the Nutrition Care Day Survey 2010. Clin. Nutr. 2013;32:737–745. doi: 10.1016/j.clnu.2012.11.021. - DOI - PubMed
-
- Daniels L. Malnutrition and Its Impact on Cost of Hospitalization, Length of Stay, Readmission and 3-Year Mortality. [(accessed on 28 October 2021)]. Available online: https://core.ac.uk/reader/10910747?utm_source=linkout. - PubMed
-
- Allard J.P., Keller H., Jeejeebhoy K.N., Laporte M., Duerksen D.R., Gramlich L., Payette H., Bernier P., Vesnaver E., Davidson B., et al. Malnutrition at Hospital Admission-Contributors and Effect on Length of Stay: A Prospective Cohort Study From the Canadian Malnutrition Task Force. JPEN J. Parenter. Enteral Nutr. 2016;40:487–497. doi: 10.1177/0148607114567902. - DOI - PubMed
-
- Schuetz P., Fehr R., Baechli V., Geiser M., Deiss M., Gomes F., Kutz A., Tribolet P., Bregenzer T., Braun N., et al. Individualised nutritional support in medical inpatients at nutritional risk: A randomised clinical trial. Lancet. 2019;393:2312–2321. doi: 10.1016/S0140-6736(18)32776-4. - DOI - PubMed
