. 2022 May 9;14(9):1975.
doi: 10.3390/nu14091975.

A High-Fat Diet Induces Muscle Mitochondrial Dysfunction and Impairs Swimming Capacity in Zebrafish: A New Model of Sarcopenic Obesity

Affiliations

A High-Fat Diet Induces Muscle Mitochondrial Dysfunction and Impairs Swimming Capacity in Zebrafish: A New Model of Sarcopenic Obesity

Yun-Yi Zou et al. Nutrients. .

Abstract

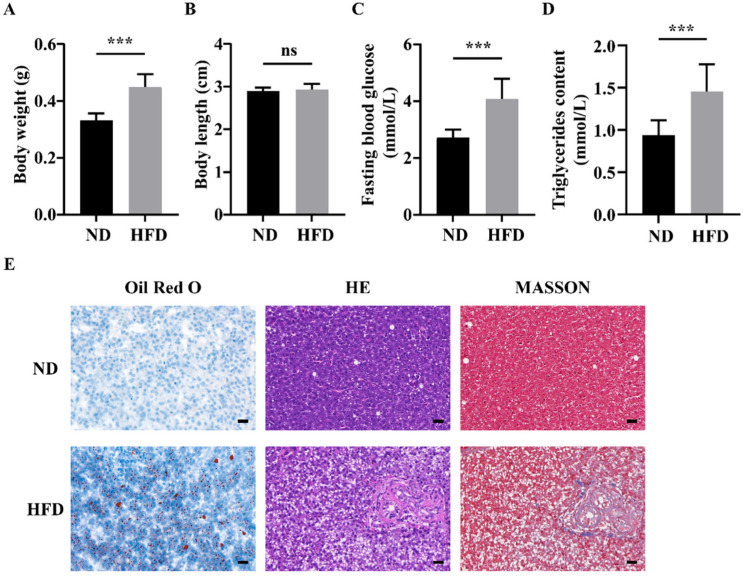
Obesity is a highly prevalent disease that can induce metabolic syndrome and is associated with a greater risk of muscular atrophy. Mitochondria play central roles in regulating the physiological metabolism of skeletal muscle; however, whether a decreased mitochondrial function is associated with impaired muscle function is unclear. In this study, we evaluated the effects of a high-fat diet on muscle mitochondrial function in a zebrafish model of sarcopenic obesity (SOB). In SOB zebrafish, a significant decrease in exercise capacity and skeletal muscle fiber cross-sectional area was detected, accompanied by high expression of the atrophy-related markers Atrogin-1 and muscle RING-finger protein-1. Zebrafish with SOB exhibited inhibition of mitochondrial biogenesis and fatty acid oxidation as well as disruption of mitochondrial fusion and fission in atrophic muscle. Thus, our findings showed that muscle atrophy was associated with SOB-induced mitochondrial dysfunction. Overall, these results showed that the SOB zebrafish model established in this study may provide new insights into the development of therapeutic strategies to manage mitochondria-related muscular atrophy.

Keywords: high-fat diet; mitochondria; muscle; sarcopenic obesity; zebrafish.


Conflict of interest statement

The authors declare no conflict of interest.

Figures

Figure 1
Figure 1
Long-term high-fat diet (HFD) feeding induced obesity and liver injury in zebrafish. (A) Body weight of zebrafish. (B) Body length of zebrafish. (C) Fasting blood glucose of zebrafish. (D) Muscle triglyceride contents. (E) Oil Red O staining, H&E staining, and Masson staining of zebrafish livers. ***, p < 0.001. Data represent means, and error bars represent standard errors of the means. Scale bar, 20 μm. ND, normal diet; HFD, high-fat diet.
Figure 2
Figure 2
Comparison of skeletal muscle fiber size between zebrafish groups. (A) Representative photomicrographs of muscle sections stained H&E or imaged using transmission electron microscopy. (B) Average fiber size (based on H&E staining). (C,D) Atrogin-1 and MuRF1 protein expression. *, p < 0.05, ***, p < 0.001. Data represent means, and error bars represent standard errors of the means. Scale bars in transmission electron microscopy images, 2 μm. Scale bars in H&E-stained images, 20 μm. ND, normal diet; HFD, high-fat diet.
Figure 3
Figure 3
Comparison of swimming capacity tests between the two groups of zebrafish. (A) The number of zebrafish in the two groups at each speed test stage. (B) MO2 levels in the two groups at each testing stage. (C) Exhaustive swimming times of zebrafish. (D) MO2max of zebrafish. (E) Ucrit of zebrafish. (F) Ucrit-r of zebrafish. ***, p < 0.001. Data represent means, and error bars represent standard errors of the means. Scale bar, 20 μm. ND, normal diet; HFD, high-fat diet; Ucrit, critical swimming speed; MO2, oxygen consumption.
Figure 4
Figure 4
Long-term HFD feeding induced abnormal mitochondrial dysfunction. (A,B) Phospho-AMPK, SIRT1, and PGC1α protein levels. (C) mRNA expression of genes related to mitochondrial biogenesis, fatty oxidation, and ETC complexes subunits. *, p < 0.05, **, p < 0.01, ***, p < 0.001. Data represent means, and error bars represent standard errors of the means. ND, normal diet; HFD, high-fat diet; ETC, electron transport chain.
Figure 5
Figure 5
Long-term HFD feeding induced abnormal mitochondrial fusion and fission. (A,B) Protein expression of OPA1, MFN2, and DRP1. (C) Representative photomicrographs of muscle sections imaged using transmission electron microscopy. M, mitochondria. *, p < 0.05, **, p < 0.01. Data represent means, and error bars represent standard errors of the means. Scale bar in transmission electron microscopy images, 0.5 μm. ND, normal diet; HFD, high-fat diet.

References

    1. Bluher M. Obesity: Global epidemiology and pathogenesis. Nat. Rev. Endocrinol. 2019;15:288–298. doi: 10.1038/s41574-019-0176-8. - DOI - PubMed
    1. Heydemann A. An Overview of Murine High Fat Diet as a Model for Type 2 Diabetes Mellitus. J. Diabetes Res. 2016;2016:2902351. doi: 10.1155/2016/2902351. - DOI - PMC - PubMed
    1. Recena Aydos L., Aparecida do Amaral L., Serafim de Souza R., Jacobowski A.C., Freitas Dos Santos E., Rodrigues Macedo M.L. Nonalcoholic Fatty Liver Disease Induced by High-Fat Diet in C57bl/6 Models. Nutrients. 2019;11:3067. doi: 10.3390/nu11123067. - DOI - PMC - PubMed
    1. Rasool S., Geetha T., Broderick T.L., Babu J.R. High Fat with High Sucrose Diet Leads to Obesity and Induces Myodegeneration. Front. Physiol. 2018;9:1054. doi: 10.3389/fphys.2018.01054. - DOI - PMC - PubMed
    1. Hoeks J., Schrauwen P. Muscle mitochondria and insulin resistance: A human perspective. Trends Endocrinol. Metab. 2012;23:444–450. doi: 10.1016/j.tem.2012.05.007. - DOI - PubMed