. 2022 Apr 19;27(9):2624.
doi: 10.3390/molecules27092624.

The Influence of High-Intensity Ultrasonication on Properties of Cellulose Produced from the Hop Stems, the Byproduct of the Hop Cones Production

Affiliations

The Influence of High-Intensity Ultrasonication on Properties of Cellulose Produced from the Hop Stems, the Byproduct of the Hop Cones Production

Monika Szymańska-Chargot et al. Molecules. .

Abstract

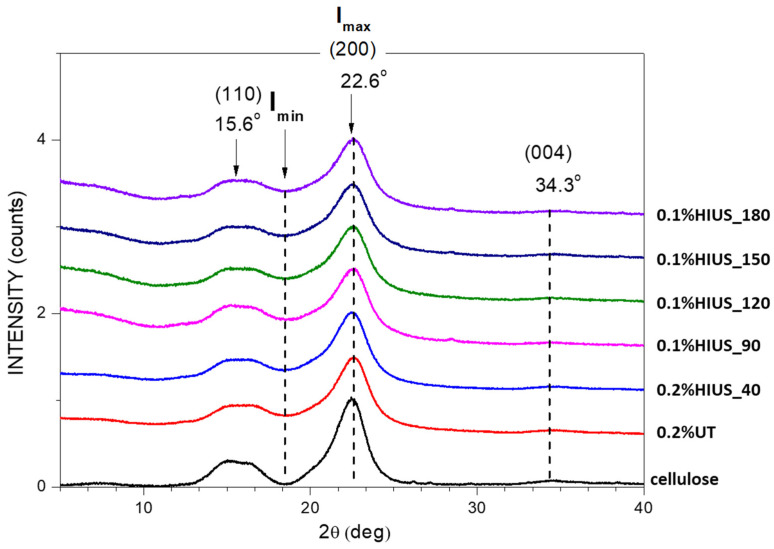
The goal of this work is to evaluate the hop stems, a byproduct of hop cones production, as a potential source of cellulose. Hop stems contain up to 29% of cellulose. The cellulose isolation was conducted through the thermochemical treatment. After high-speed blending, the cellulose was characterized by 67% of crystallinity degree obtained from X-ray diffraction and median diameter of 6.7 nm obtained from atomic force microscopy imaging. The high-intensity ultrasonication (HIUS) was applied to reach further disintegration of cellulose fibers. The longer HIUS treatment resulted in decrease in crystallinity degree even up to 60% and decrease in the fiber diameter up to 4 nm. The Fourier transform infrared spectroscopy (FTIR) spectra showed that HIUS treatment led to changes in intermolecular hydrogen bonds. The stability of cellulose dispersions versus length of HIUS treatment was monitored over 14 days with back dynamic light scattering and laser Doppler electrophoresis methods. Obtained results are evidence that the hop stems are a potential source of cellulose and that it is possible to obtain stable dispersions after HIUS treatment. This was the first time that the properties of hop cellulose have been described so extensively and in detail after the use of HIUS treatment.

Keywords: cellulose; hop byproducts; hop stems; nanocellulose.


Conflict of interest statement

The authors declare no conflict of interest.

Figures

Figure 1
Figure 1
FTIR spectrum of dried raw hop stems in range 4000—650 cm−1 (region 2750–1800 was cut out due to lack of spectral information).
Figure 2
Figure 2
Changes in diameter of cellulose fibers with respect to applied ultrasound treatment. Points on the main plot indicate median values of fiber diameters, while whiskers indicate lower (Q1) and upper quartile (Q3), respectively. Subplot shows distribution of fiber diameters in logarithmic scale; different letters mean the significantly different results at p < 0.05.
Figure 3
Figure 3
X-ray diffraction pattern of cellulose isolated for hop stems before (cellulose, 0.2%UT) and after HIUS treatment. The main diffraction reflections with Miller indices of dominant planes are denoted in the graph.
Figure 4
Figure 4
DSC curves of the studied cellulose after HIUS treatment.
Figure 5
Figure 5
FTIR spectra of cellulose isolated from hop stems before and after HIUS treatment are presented in the range of 4000–2900 cm−1 and 1750–650 cm−1. The most characteristic bands are highlighted on spectra with dashed line.
Figure 6
Figure 6
(a) The logarithm of the relaxation time marked as log(τ) as well as (b) zeta potential (ZP) and electrophoretic mobility (EM) of cellulose; bars indicate standard deviation; different letters represent statistically significantly different results (one-way ANOVA and the Tukey’ HSD post hoc test, p < 0.05).
Figure 7
Figure 7
Relative log(τ) obtained during 14 days of experiment for (a) cellulose microfibrils (0.2% UT), (b) 0.2% dispersion of cellulose prepared using high-intensity ultrasonication for 40 min. (0.2% HIUS_40), and 0.1% dispersion of cellulose prepared using high-intensity ultrasonication for (c) 90 min. (0.1% HIUS_90), (d) 120 min. (0.1% HIUS_120), (e) 150 min. (0.1% HIUS_150), and (f) 180 min. (0.1% HIUS_180), respectively; red solid line marks relative log(τ) equal to 1; dotted lines show the fitted trend lines. The photographs of cuvette with cellulose dispersion are related to the consecutive days of measurements (0—initial day, 1—first day, 7—seventh day, 14—fourteenth day).
Figure 7
Figure 7
Relative log(τ) obtained during 14 days of experiment for (a) cellulose microfibrils (0.2% UT), (b) 0.2% dispersion of cellulose prepared using high-intensity ultrasonication for 40 min. (0.2% HIUS_40), and 0.1% dispersion of cellulose prepared using high-intensity ultrasonication for (c) 90 min. (0.1% HIUS_90), (d) 120 min. (0.1% HIUS_120), (e) 150 min. (0.1% HIUS_150), and (f) 180 min. (0.1% HIUS_180), respectively; red solid line marks relative log(τ) equal to 1; dotted lines show the fitted trend lines. The photographs of cuvette with cellulose dispersion are related to the consecutive days of measurements (0—initial day, 1—first day, 7—seventh day, 14—fourteenth day).

References

    1. Reddy N., Yang Y. Properties of natural cellulose fibers from hop stems. Carbohydr. Polym. 2009;77:898–902. doi: 10.1016/j.carbpol.2009.03.013. - DOI
    1. Hop Report for the Harvest Year 2018. May 19, 2019. [(accessed on 15 October 2020)]. Available online: https://ec.europa.eu/info/food-farming-fisheries/plants-and-plant-produc....
    1. Dufresne A., editor. Nanocellulose: From Nature to High Performance Tailored Materials. De Gruyter; Berlin, Germany: 2012.
    1. Brett C., Waldron K., Black M., Chapman J., editors. Physiology and Biochemistry of Plant Cell Wall in Topics in Plant Physiology. Unwin Hyman Ltd.; London, UK: 1990. pp. 4–57.
    1. Bras J., Viet D., Bruzzese C., Dufresne A. Correlation between stiffness of sheets prepared from cellulose whiskers and nanoparticles dimensions. Carbohydr. Polym. 2011;84:211–215. doi: 10.1016/j.carbpol.2010.11.022. - DOI

LinkOut - more resources