

A Quinoxaline-Naphthaldehyde Conjugate for Colorimetric Determination of Copper Ion
- PMID: 35566259
- PMCID: PMC9105850
- DOI: 10.3390/molecules27092908
A Quinoxaline-Naphthaldehyde Conjugate for Colorimetric Determination of Copper Ion
Abstract
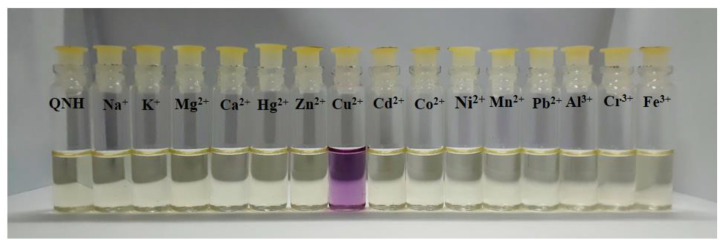
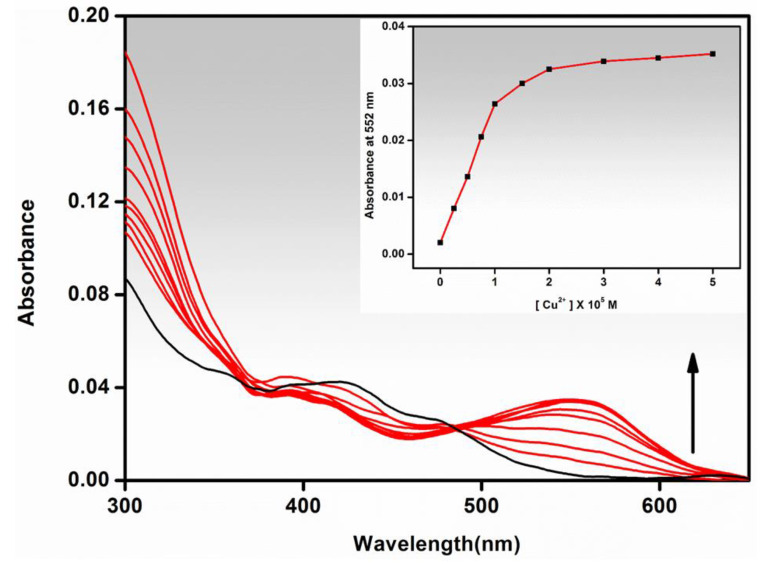
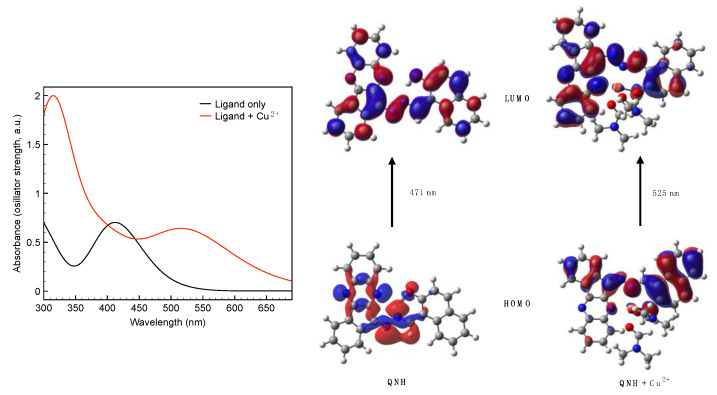
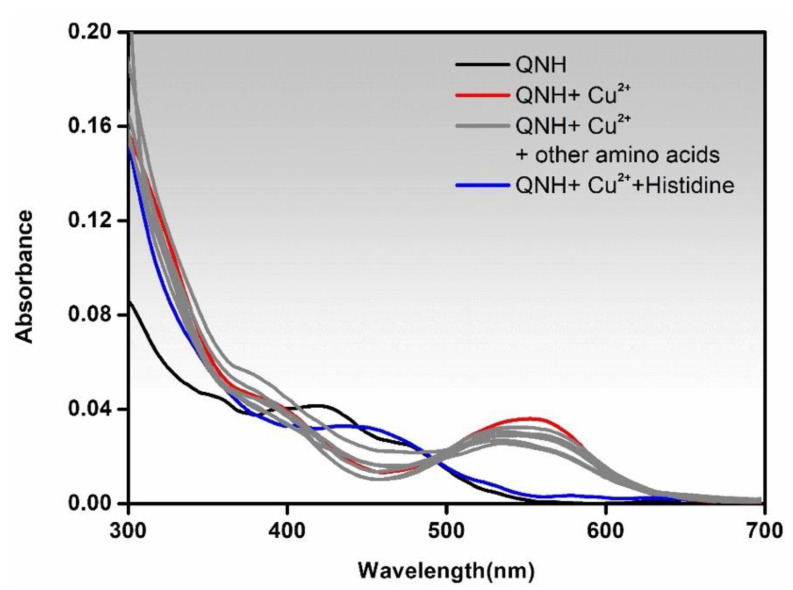
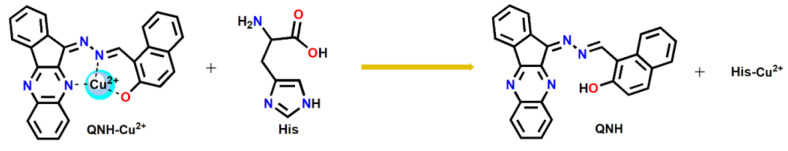
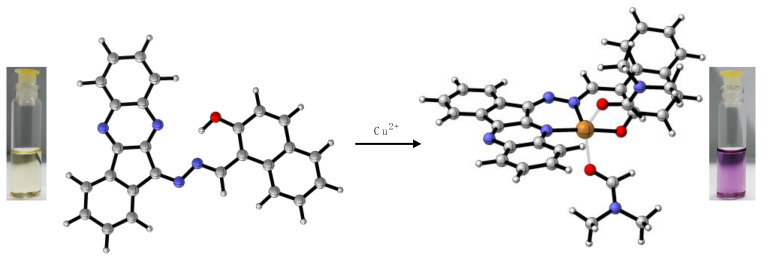
This work facilitates detection of bivalent copper ion by a simple Schiff base probe QNH based on a quinoxaline-naphthaldehyde framework. The detailed study in absorption spectroscopy and theoretical aspects and crystal study of the probe and probe-copper complex has been discussed. The detection limit of the probe in the presence of Cu2+ is 0.45 µM in HEPES-buffer/acetonitrile (3/7, v/v) medium for absorption study. The reversibility of the probe-copper complex has been investigated by EDTA. The selective visual detection of copper has been established also in gel form.
Keywords: Cu2+ colorimetric detection; ab initio calculations; absorption study; quinoxaline−naphthaldehyde conjugate.
Conflict of interest statement
The authors declare no conflict of interest.
Figures
Similar articles
-
A new Schiff base fluorescent probe for imaging Cu2+ in living cells.Spectrochim Acta A Mol Biomol Spectrosc. 2013 Aug;112:132-8. doi: 10.1016/j.saa.2013.03.093. Epub 2013 Apr 22. Spectrochim Acta A Mol Biomol Spectrosc. 2013. PMID: 23666347
-
Schiff Base Functionalized 1,2,4-Triazole and Pyrene Derivative for Selective and Sensitive Detection of Cu2+ ion in the Mixed Organic- Aqueous Media.J Fluoresc. 2021 Nov;31(6):1739-1749. doi: 10.1007/s10895-021-02802-4. Epub 2021 Sep 1. J Fluoresc. 2021. PMID: 34468922
-
Visible-near-infrared and fluorescent copper sensors based on julolidine conjugates: selective detection and fluorescence imaging in living cells.Chemistry. 2011 Sep 26;17(40):11152-61. doi: 10.1002/chem.201101906. Epub 2011 Sep 1. Chemistry. 2011. PMID: 21882277
-
A reversible and highly selective two-photon fluorescent "on-off-on" probe for biological Cu2+ detection.Org Biomol Chem. 2018 Mar 28;16(13):2264-2268. doi: 10.1039/c8ob00257f. Org Biomol Chem. 2018. PMID: 29532844
-
A fluorescent and colorimetric Schiff base chemosensor for the detection of Zn2+ and Cu2+: Application in live cell imaging and colorimetric test kit.Spectrochim Acta A Mol Biomol Spectrosc. 2019 Mar 15;211:34-43. doi: 10.1016/j.saa.2018.11.058. Epub 2018 Nov 23. Spectrochim Acta A Mol Biomol Spectrosc. 2019. PMID: 30502582
Cited by
-
A Low-Cost Colorimetric Assay for the Analytical Determination of Copper Ions with Consumer Electronic Imaging Devices in Natural Water Samples.Molecules. 2023 Jun 17;28(12):4831. doi: 10.3390/molecules28124831. Molecules. 2023. PMID: 37375386 Free PMC article.
References
-
- Wang H., Zhu Q.-L., Zou R., Xu Q. Metal-organic frameworks for energy applications. Chem. 2017;2:52–80. doi: 10.1016/j.chempr.2016.12.002. - DOI
-
- Lai C.-H., Lu M.-Y., Chen L.-J. Metal sulfide nanostructures: Synthesis, properties and applications in energy conversion and storage. J. Mater. Chem. 2012;22:19–30. doi: 10.1039/C1JM13879K. - DOI
-
- Liu W., Yin X.-B. Metal–organic frameworks for electrochemical applications. Trends Anal. Chem. 2016;75:86–96. doi: 10.1016/j.trac.2015.07.011. - DOI
-
- Assche F.V., Clijsters H. Effects of metals on enzyme activity in plants. Plant Cell Environ. 1990;13:195–206. doi: 10.1111/j.1365-3040.1990.tb01304.x. - DOI
MeSH terms
Substances
Grants and funding
LinkOut - more resources
Full Text Sources
