. 2022 May 9;27(9):3041.
doi: 10.3390/molecules27093041.

Accelerating AutoDock Vina with GPUs

Affiliations

Accelerating AutoDock Vina with GPUs

Shidi Tang et al. Molecules. .

Abstract

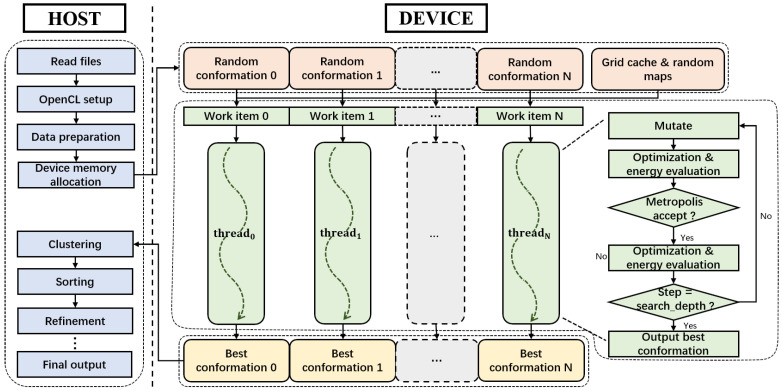
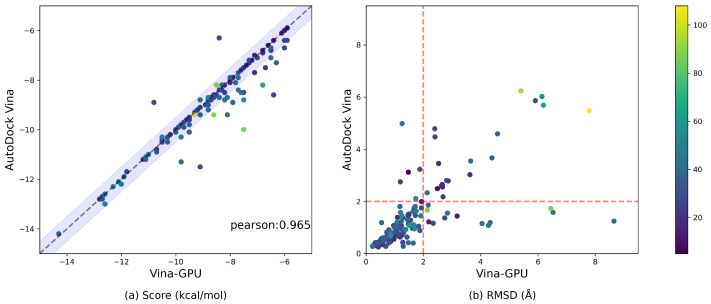
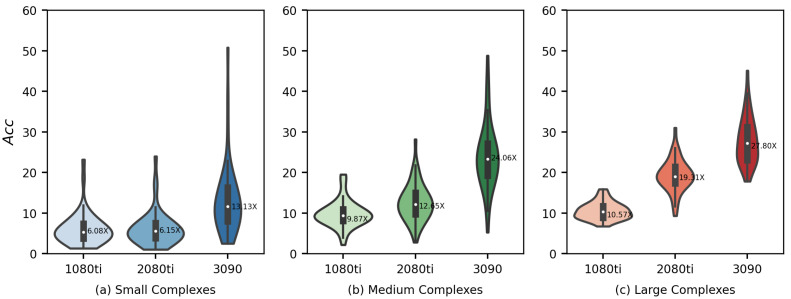
AutoDock Vina is one of the most popular molecular docking tools. In the latest benchmark CASF-2016 for comparative assessment of scoring functions, AutoDock Vina won the best docking power among all the docking tools. Modern drug discovery is facing a common scenario of large virtual screening of drug hits from huge compound databases. Due to the seriality characteristic of the AutoDock Vina algorithm, there is no successful report on its parallel acceleration with GPUs. Current acceleration of AutoDock Vina typically relies on the stack of computing power as well as the allocation of resource and tasks, such as the VirtualFlow platform. The vast resource expenditure and the high access threshold of users will greatly limit the popularity of AutoDock Vina and the flexibility of its usage in modern drug discovery. In this work, we proposed a new method, Vina-GPU, for accelerating AutoDock Vina with GPUs, which is greatly needed for reducing the investment for large virtual screens and also for wider application in large-scale virtual screening on personal computers, station servers or cloud computing, etc. Our proposed method is based on a modified Monte Carlo using simulating annealing AI algorithm. It greatly raises the number of initial random conformations and reduces the search depth of each thread. Moreover, a classic optimizer named BFGS is adopted to optimize the ligand conformations during the docking progress, before a heterogeneous OpenCL implementation was developed to realize its parallel acceleration leveraging thousands of GPU cores. Large benchmark tests show that Vina-GPU reaches an average of 21-fold and a maximum of 50-fold docking acceleration against the original AutoDock Vina while ensuring their comparable docking accuracy, indicating its potential for pushing the popularization of AutoDock Vina in large virtual screens.

Keywords: AutoDock Vina; GPU; OpenCL; Vina-GPU.


Conflict of interest statement

The authors declare no conflict of interest.

Figures

Figure 1
Figure 1
The OpenCL architecture for implementing Vina-GPU, which consists of a host (CPU) and a device (GPU) part of execution. The device part implements thousands of docking threads, each of which is assigned with an OpenCL work item to perform a Monte Carlo-based local search method with largely reduced search iterations.
Figure 2
Figure 2
Transformation the original node tree structure into the node-list format. The heterogeneous node tree was reconstructed in its traversed order (depth-first) into the node list where an additional children map was built to reflect the relationship among the nodes. For example, the node 0 has two children-nodes (the node 1 and the node 4) and so the row 0 has two “T”s (indicating “True”) in the 1st and 4th column.
Figure 3
Figure 3
Influence of the size of thread on docking accuracy (score and RMSD) and docking runtime of Vina-GPU in (a), (b) and (c), respectively. Three typical PDB complexes are randomly selected from all 140 complexes which represent small, medium and large ones, respectively (5tim—small, 5 atoms; 2bm2—medium, 33 atoms; 1jyq—large, 60 atoms). All experiments were executed on NVIDIA RTX 3090 GPU card.
Figure 4
Figure 4
Influence of the size of search_depth on docking accuracy (score and RMSD) and docking runtime of Vina-GPU in (a), (b) and (c), respectively. Three typical PDB complexes were randomly selected from all 140 complexes which represent small, medium and large ones, respectively (5tim—small, 5 atoms; 2bm2—medium, 33 atoms; 1jyq—large, 60 atoms). All experiments were executed on NVIDIA RTX 3090 GPU card.
Figure 5
Figure 5
Comparable docking accuracy between AutoDock Vina and our Vina-GPU on all 140 complexes. The color bar encodes the number of atoms in a ligand. A margin of 0.5 kcal/mol difference on the docking score between Vina-GPU and AutoDock is highlighted in lavender in (a). The Pearson correlation coefficient of their docking scores is 0.965 (indicated by “pearson”). The RMSD value that indicates an acceptable binding pose (<2 Å) are separated by a red dashed line in (b).
Figure 6
Figure 6
Acceleration of docking time (Acc) of our Vina-GPU against AutoDock Vina on three different GPUs and various scales of complexity (small—5–23 atoms, medium—24–36 atoms, large—37–108 atoms). 1080ti—NVIDIA Geforce GTX 1080ti; 2080ti—Nvidia Geforce RTX 2080Ti; 3090—Nvidia Geforce RTX 3090.
Figure 7
Figure 7
Details for the acceleration of docking time (Acc) of our Vina-GPU against AutoDock Vina on all 140 complexes. The complexity is depicted with their number of atoms (Natom) and rotatable bonds (Nrot). The vertical axis ranges from 0 to 60, and each bar represents a complex coupling with its corresponding acceleration (Acc). Vina-GPU 1080ti, Vina-GPU 2080ti and Vina-GPU 3090 mean that Vina-GPU was executed on Nvidia Geforce GTX 1080ti, Nvidia Geforce RTX 2080Ti and Nvidia Geforce RTX 3090, respectively. The color depth of each bar indicates the value of accelerations (the darker the higher).
Figure 8
Figure 8
Acceleration ratio on Accd of our Vina-GPU against AutoDock Vina on three different GPUs and various scales of complexity according to their Natom sizes (small—5–23 atoms, medium—24–36 atoms, large—37–108 atoms). 1080ti—NVIDIA Geforce GTX 1080ti; 2080ti—Nvidia Geforce RTX 2080Ti; 3090—Nvidia Geforce RTX 3090.
Figure 9
Figure 9
Details for the acceleration of docking time (Accd) of our Vina-GPU against AutoDock Vina on all 140 complexes. The complexity is depicted with their number of atoms (Natom) and rotatable bonds (Nrot). The vertical axis ranges from 0 to 210, and each bar represents a complex coupling with its corresponding acceleration ratio. Vina-GPU 1080ti, Vina-GPU 2080ti and Vina-GPU 3090 mean that Vina-GPU was executed on Nvidia Geforce GTX 1080ti, Nvidia Geforce RTX 2080Ti and Nvidia Geforce RTX 3090, respectively. The color depth of each bar indicates the value of accelerations (the darker the higher).
Figure 10
Figure 10
Similar distribution of full conformation spaces (PDBid: 2bm2) explored by AutoDock Vina or our Vina-GPU with various hyperparameter settings. AutoDock Vina (cpu=1, exhaustiveness=1) was executed with one initial conformation and search_depth=22,365 by default. Vina-GPU was performed under different scales of docking threads with various search_depth in each thread. The whole searching iterations (=thread×search_depth) keep almost the same. Each conformation is represented by its position, orientation and torsion (POT), all of which are plotted with orange dots in AutoDock Vina and bule dots in Vina-GPU. The principal component analysis (PCA) method was used to reduce the dimensions of orientation or torsion into three. The best conformations for their final output are highlighted with red stars (pointed by arrows). (a) AutoDock Vina: 1 initial conformation with search_depth=22,365. (b) Vina-GPU: 10 docking threads with search_depth=2237. (c) Vina-GPU: 100 docking threads with search_depth=224. (d) Vina-GPU: 1000 docking threads with search_depth=22.
Figure 11
Figure 11
Comparable docking accuracy by the implementation of Vina-GPU on CPUs. All 140 complexes were used, and the color bar encodes the number of atoms in a ligand. A margin of 0.5 kcal/mol difference on the docking score for the implementation of Vina-GPU on CPUs or GPUs is highlighted with lavender in (a). The Pearson correlation coefficient of their docking scores is 0.966 (indicated by “pearson”). The RMSD value that indicates an acceptable binding pose (<2 Å) is separated by a red dashed line in (b).
Figure 12
Figure 12
Acceleration of docking time (Acc) of the Vina-GPU implementations on CPUs (indicated by “CPU”) against on GPUs (indicated by “GPU”). All 140 complexes are classified into three sub-datasets with different complexity (small—5–23 atoms, medium—24–36 atoms, large—37–108 atoms). The average acceleration is highlighted with a white dot in the center. The implementation of Vina-GPU on GPUs was executed on Nvidia Geforce RTX 3090 (identical to the results in Figure 6) and that on CPUs was executed on Intel (R) Core (TM) i9-10900K CPU @ 3.7 GHz.
Figure 13
Figure 13
Comparable docking scores between AutoDock Vina and our Vina-GPU on all 9125 compounds from the drugbank dataset. The color bar encodes the number of atoms in one ligand. A margin of 0.5 kcal/mol difference on the docking score between AutoDock and our Vina-GPU is highlighted in lavender. The Pearson correlation coefficient of their docking scores is 0.981 (indicated by “pearson”).

Similar articles

Cited by

References

    1. Meng X.Y., Zhang H.X., Mezei M., Cui M. Molecular docking: A powerful approach for structure-based drug discovery. Curr. Comput.-Aided Drug Des. 2011;7:146–157. doi: 10.2174/157340911795677602. - DOI - PMC - PubMed
    1. Lengauer T., Rarey M. Computational methods for biomolecular docking. Curr. Opin. Struct. Biol. 1996;6:402–406. doi: 10.1016/S0959-440X(96)80061-3. - DOI - PubMed
    1. Cherkasov A., Muratov E.N., Fourches D., Varnek A., Baskin I.I., Cronin M., Dearden J., Gramatica P., Martin Y.C., Todeschini R., et al. QSAR modeling: Where have you been? Where are you going to? J. Med. Chem. 2014;57:4977–5010. doi: 10.1021/jm4004285. - DOI - PMC - PubMed
    1. Golbraikh A., Shen M., Xiao Z., Xiao Y.D., Lee K.H., Tropsha A. Rational selection of training and test sets for the development of validated QSAR models. J. Comput.-Aided Mol. Des. 2003;17:241–253. doi: 10.1023/A:1025386326946. - DOI - PubMed
    1. Morris G.M., Huey R., Lindstrom W., Sanner M.F., Belew R.K., Goodsell D.S., Olson A.J. AutoDock4 and AutoDockTools4: Automated docking with selective receptor flexibility. J. Comput. Chem. 2009;30:2785–2791. doi: 10.1002/jcc.21256. - DOI - PMC - PubMed

LinkOut - more resources