

How Is Body Composition and Nutrition Status Associated with Erythropoietin Response in Hemodialyzed Patients? A Single-Center Prospective Cohort Study
- PMID: 35566552
- PMCID: PMC9105329
- DOI: 10.3390/jcm11092426
How Is Body Composition and Nutrition Status Associated with Erythropoietin Response in Hemodialyzed Patients? A Single-Center Prospective Cohort Study
Abstract
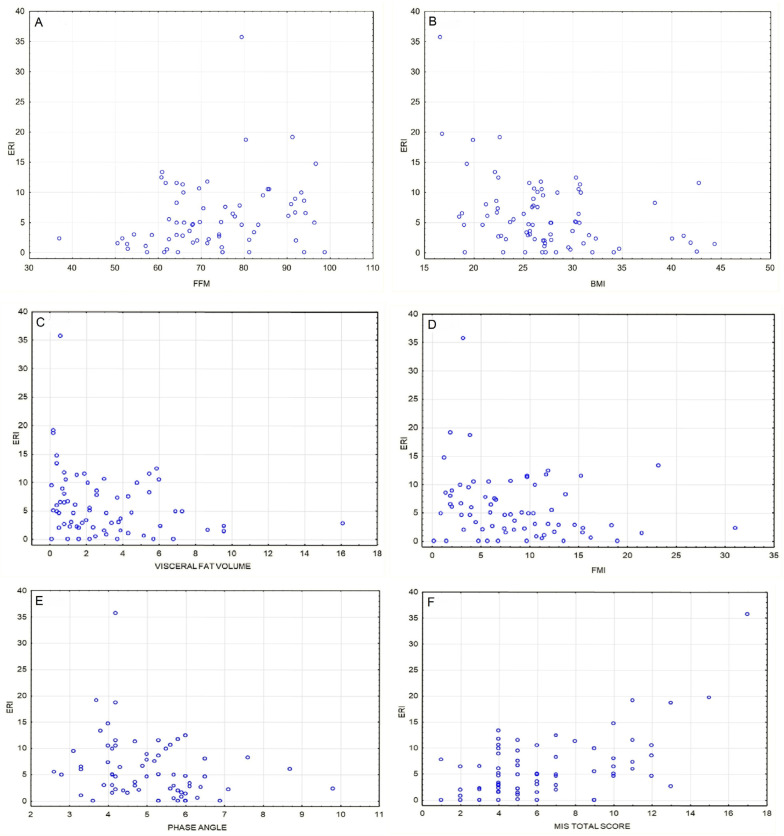
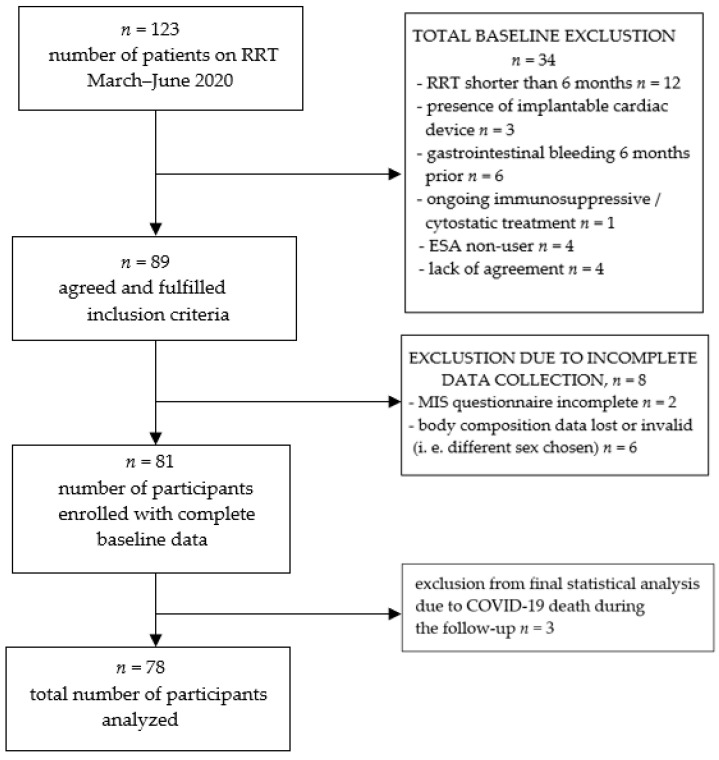
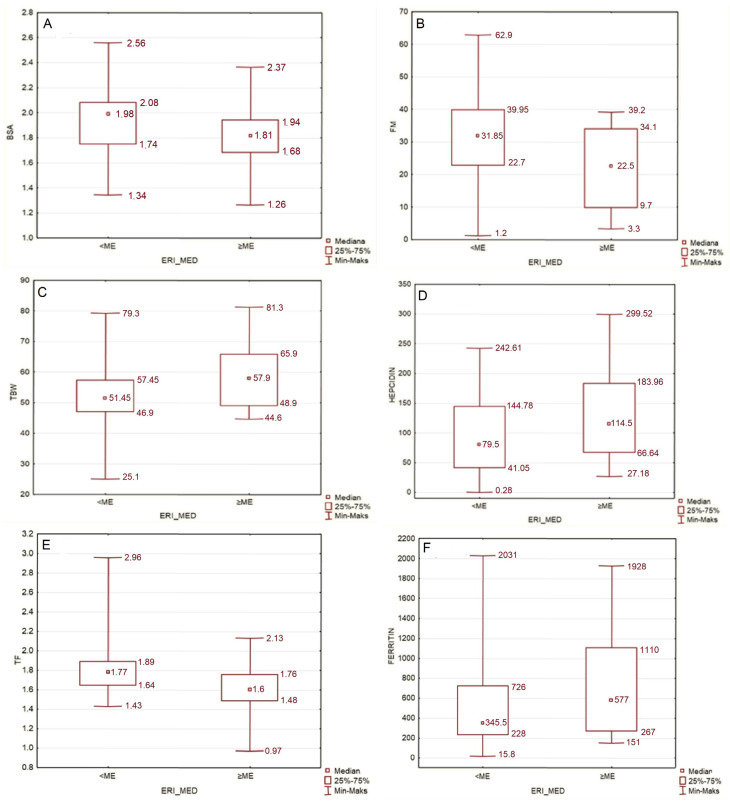
Background: Anemia is the most common finding in patients with end-stage kidney disease undergoing renal replacement therapy. A certain percentage of patients does not respond adequately to erythropoietin (EPO) treatment, not being able to reach desirable hemoglobin levels even when treated with large-dose EPO and intravenous/oral iron. In our study, we wanted to further investigate how nutritional status is associated with erythropoietin responsiveness. To quantify EPO response, we used the Erythropoietin Resistance Index (ERI), which is defined as the weekly weight-adjusted dose of EPO divided by the hemoglobin level. Patients and methods: Seventy-eight patients undergoing hemodialysis were included. All of them were measured by a SECA mBCA body composition analyzer and evaluated by Kalantar-Zadeh’s MIS score. Routine biochemical tests were also taken into account. The Shapiro-Wilk test was used to study the distributions of quantitative variables, which were significantly different from normal (p < 0.05). We used nonparametric Mann-Whitney U-test to compare groups. Correlations were studied by means of Spearman’s rank correlation coefficient. Bonferroni correction for multiple testing was performed. To find independent determinants of ERI, we additionally performed multivariate analysis using the General Linear Model (GLM). Results: In terms of body composition, factors that are associated with high ERI are low BMI, low fat mass, low visceral fat volume, high total body water percentage, low phase angle and low fat-free mass. In addition to body composition parameters, total MIS score and IL-6 serum levels correlated positively with ERI value. IL-6 was an independent determinant of ERI value, based on multivariate analysis. After correction for multiple analysis, BMI and eGFR both remained significant factors associated with EPO response. Conclusions: It seems crucial to prevent inflammatory malnutrition as a part of a holistic approach to anemia treatment in dialysis patients.
Keywords: ERI; anemia; body composition; erythropoietin resistance; hemodialysis.
Conflict of interest statement
The authors declare no conflict of interest.
Figures
References
-
- AHTAPol Agencja Oceny Technologii Medycznych i Taryfikacji. [(accessed on 23 October 2021)]; Available online: http://www.aotm.gov.pl/www/index.php?id=398.
-
- Harvinder G.S., Swee W.C.S., Karupaiah T., Sahathevan S., Chinna K., Ahmad G., Bavanandan S., Goh B.L. Dialysis Malnutrition and Malnutrition Inflammation Scores: Screening Tools for Prediction of Dialysis—Related Protein-Energy Wasting in Malaysia. Asia Pac. J. Clin. Nutr. 2016;25:26–33. doi: 10.6133/apjcn.2016.25.1.01. - DOI - PubMed
LinkOut - more resources
Full Text Sources
Research Materials
Miscellaneous
