. 2022 Apr 30;11(9):2526.
doi: 10.3390/jcm11092526.

Effect of Matrix Size Reduction on Textural Information in Clinical Magnetic Resonance Imaging

Affiliations

Effect of Matrix Size Reduction on Textural Information in Clinical Magnetic Resonance Imaging

Michał Strzelecki et al. J Clin Med. .

Abstract

The selection of the matrix size is an important element of the magnetic resonance imaging (MRI) process, and has a significant impact on the acquired image quality. Signal to noise ratio, often used to assess MR image quality, has its limitations. Thus, for this purpose we propose a novel approach: the use of texture analysis as an index of the image quality that is sensitive for the change of matrix size. Image texture in biomedical images represents tissue and organ structures visualized via medical imaging modalities such as MRI. The correlation between texture parameters determined for the same tissues visualized in images acquired with different matrix sizes is analyzed to aid in the assessment of the selection of the optimal matrix size. T2-weighted coronal images of shoulders were acquired using five different matrix sizes while maintaining the same field of view; three regions of interest (bone, fat, and muscle) were considered. Lin's correlation coefficients were calculated for all possible pairs of the 310-element texture feature vectors evaluated for each matrix. The obtained results are discussed considering the image noise and blurring effect visible in images acquired with smaller matrices. Taking these phenomena into account, recommendations for the selection of the matrix size used for the MRI imaging were proposed.

Keywords: image quality; magnetic resonance; matrix size; texture analysis.


Conflict of interest statement

The authors declare that they have no conflict of interest.

Figures

Figure 1
Figure 1
Block diagram presents MR scanner position in the workflow algorithm of radiological decisions made before scanning patients. Notice importance of matrix size setting in the decision process.
Figure 2
Figure 2
Graphic representation of K-space concept. A represents the center of the K-space area where the signal strength is encoded. B indicates the K-space periphery and presents the encoded spatial information of the image. A gradient frequency modulates the alignment of the signal, and it is set by the MR machine operator when the image acquisition matrix is selected.
Figure 3
Figure 3
Number of publications on TA of medical images according to the Scopus database (accessed on 01 February 2022, www.scopus.com).
Figure 4
Figure 4
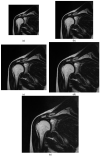
Sample analyzed images acquired for matrices with various sizes under the same FOV. (a) 256 × 256; (b) 320 × 320; (c) 384 × 384; (d) 448 × 448; (e) 512 × 512.
Figure 5
Figure 5
Position of ROIs used for analyzing different tissue types (bone: red; fat: blue; and muscle: green).
Figure 6
Figure 6
Average Lin’s coefficients for all texture features evaluated between neighboring matrices.
Figure 6
Figure 6
Average Lin’s coefficients for all texture features evaluated between neighboring matrices.
Figure 7
Figure 7
Average Lin’s coefficients for analyzed texture features evaluated between neighboring matrices. ARM—Autoregressive Model, DWT—Discrete Wavelet Transform (Haar wavelet), GAB—Gabor Transform, GLCM—Grey Level Coocurrence Matrix, GRA—Gradient matrix, GRLM—Grey Level Run-Length Matrix, HIST—Histogram, HOG—Histogram of Oriented Gradients.
Figure 7
Figure 7
Average Lin’s coefficients for analyzed texture features evaluated between neighboring matrices. ARM—Autoregressive Model, DWT—Discrete Wavelet Transform (Haar wavelet), GAB—Gabor Transform, GLCM—Grey Level Coocurrence Matrix, GRA—Gradient matrix, GRLM—Grey Level Run-Length Matrix, HIST—Histogram, HOG—Histogram of Oriented Gradients.
Figure 8
Figure 8
Acquisition times for all patients.
Figure 9
Figure 9
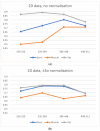
(a) Values of correlation coefficients averaged at all transitions between matrices; (b) mean change of correlation coefficients at all transitions between the matrices.
Figure 9
Figure 9
(a) Values of correlation coefficients averaged at all transitions between matrices; (b) mean change of correlation coefficients at all transitions between the matrices.
Figure 10
Figure 10
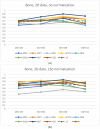
Effects of normalization on the values of correlation at all between–matrices transitions. No normalization: (a) bone, (b) muscle; Normalization: (c) bone and (d) muscle.
Figure 10
Figure 10
Effects of normalization on the values of correlation at all between–matrices transitions. No normalization: (a) bone, (b) muscle; Normalization: (c) bone and (d) muscle.
Figure 11
Figure 11
Mean SNR values (averaged for all patients) evaluated for all matrices and analyzed tissues.
Figure 12
Figure 12
Image sharpness evaluated for all matrices and analyzed tissues.

References

    1. Xu Q.G., Xian J.F. Role of quantitative magnetic resonance imaging parameters in the evaluation of treatment response in ma-lignant tumors. Chin. Med. J. 2015;128:1128–1133. doi: 10.4103/0366-6999.155127. - DOI - PMC - PubMed
    1. Börnert P., Norris D.G. A half-century of innovation in technology—Preparing MRI for the 21st century. Br. J. Radiol. 2020;93:20200113. doi: 10.1259/bjr.20200113. - DOI - PMC - PubMed
    1. Jung B.A., Weigel M. Spin echo magnetic resonance imaging. J. Magn. Reason. Imaging. 2013;37:805–817. doi: 10.1002/jmri.24068. - DOI - PubMed
    1. Jackson E.F., Ginsberg L.E., Schomer D.F., Leeds N.E. A review of MRI pulse sequences and techniques in neuroimaging. Surg. Neurol. 1997;47:185–199. doi: 10.1016/S0090-3019(96)00375-8. - DOI - PubMed
    1. Collewet G., Strzelecki M., Mariette F. Influence of MRI acquisition protocols and image intensity normalization methods on texture classification. Magn. Reson. Imaging. 2004;22:81–91. doi: 10.1016/j.mri.2003.09.001. - DOI - PubMed

LinkOut - more resources