

Preparation and Characterization of PEDOT:PSS/TiO2 Micro/Nanofiber-Based Gas Sensors
- PMID: 35566945
- PMCID: PMC9105644
- DOI: 10.3390/polym14091780
Preparation and Characterization of PEDOT:PSS/TiO2 Micro/Nanofiber-Based Gas Sensors
Abstract
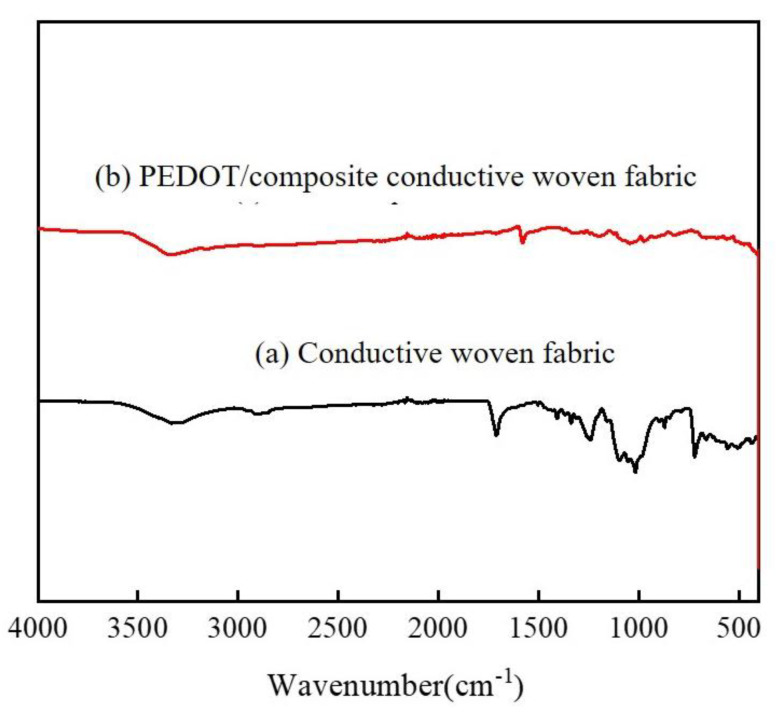
In this study, we employed electrospinning technology and in situ polymerization to prepare wearable and highly sensitive PVP/PEDOT:PSS/TiO2 micro/nanofiber gas sensors. PEDOT, PEDOT:PSS, and TiO2 were prepared via in situ polymerization and tested for characteristic peaks using energy-dispersive X-ray spectroscopy (EDS) and Fourier transform infrared spectroscopy (FT-IR), then characterized using a scanning electron microscope (SEM), a four-point probe resistance measurement, and a gas sensor test system. The gas sensitivity was 3.46-12.06% when ethanol with a concentration between 12.5 ppm and 6250 ppm was measured; 625 ppm of ethanol was used in the gas sensitivity measurements for the PEDOT/composite conductive woven fabrics, PVP/PEDOT:PSS nanofiber membranes, and PVP/PEDOT:PSS/TiO2 micro/nanofiber gas sensors. The latter exhibited the highest gas sensitivity, which was 5.52% and 2.35% greater than that of the PEDOT/composite conductive woven fabrics and PVP/PEDOT:PSS nanofiber membranes, respectively. In addition, the influence of relative humidity on the performance of the PVP/PEDOT:PSS/TiO2 micro/nanofiber gas sensors was examined. The electrical sensitivity decreased with a decrease in ethanol concentration. The gas sensitivity exhibited a linear relationship with relative humidity lower than 75%; however, when the relative humidity was higher than 75%, the gas sensitivity showed a highly non-linear correlation. The test results indicated that the PVP/PEDOT:PSS/TiO2 micro/nanofiber gas sensors were flexible and highly sensitive to gas, qualifying them for use as a wearable gas sensor platform at room temperature. The proposed gas sensors demonstrated vital functions and an innovative design for the development of a smart wearable device.
Keywords: gas sensitivity; gas-sensitive nanofiber; micro/nanofiber gas sensor; smart wearable device.
Conflict of interest statement
The authors declare no conflict of interest.
Figures


References
-
- Winter I., Reese C., Hormes J., Heywang G., Jonas F. The thermal ageing of poly (3, 4-ethylenedioxythiophene). An investigation by X-ray absorption and X-ray photoelectron spectroscopy. Chem. Phys. 1995;194:207–213. doi: 10.1016/0301-0104(95)00026-K. - DOI
-
- Hidayat S.N., Julian T., Rianjanu A., Kusumaatmadja A., Triyana K. Quartz crystal microbalance coated by PAN nanofibers and PEDOT: PSS for humidity sensor; Proceedings of the 2017 International Seminar on Sensors, Instrumentation, Measurement and Metrology (ISSIMM); Surabaya, Indonesia. 25–26 August 2017; pp. 119–123.
LinkOut - more resources
Full Text Sources
