. 2022 Apr 26;11(9):1167.
doi: 10.3390/plants11091167.

Transcriptomic Analysis Elaborates the Resistance Mechanism of Grapevine Rootstocks against Salt Stress

Affiliations

Transcriptomic Analysis Elaborates the Resistance Mechanism of Grapevine Rootstocks against Salt Stress

Fanggui Zhao et al. Plants (Basel). .

Abstract

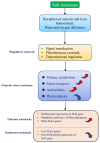
Grapes are subject to a wide range of climatic conditions during their life cycle, but the use of rootstocks can effectively ameliorate the effects of abiotic stress. However, the tolerance mechanism of different grape rootstock varieties varies under various stresses, and systematic research on this aspect is limited. On the basis of previous research, transcriptome sequencing was performed on three tolerant grape rootstock varieties (3309C, 520A, 1103P) and three intolerant grape rootstock varieties (5BB, 101-14, Beta). In total, 56,478,468 clean reads were obtained. One hundred and ten genes only existed in all combinations during P1 with a downregulated trend, and 178 genes existed only in P1 of tolerant grape rootstock varieties. Salt treatment firstly affected the photosynthesis of leaves, and tolerant varieties weakened or even eliminated this effect through their own mechanisms in the later stage. Tolerant varieties mobilized a large number of MFs during the P2 stage, such as hydrolase activity, carboxypeptidase activity, and dioxygenase activity. Carbon metabolism was significantly enriched in P1, while circadian rhythm and flavonoid biosynthesis were only enriched in tolerant varieties. In the intolerant varieties, photosynthesis-related pathways were always the most significantly enriched. There were large differences in the gene expression of the main signal pathways related to salt stress in different varieties. Salt stress affected the expression of genes related to plant abiotic stress, biotic stress, transcription factors, hormones, and secondary metabolism. Tolerant varieties mobilized more bHLH, WRKY, and MYB transcription factors to respond to salt stress than intolerant varieties. In the tolerant rootstocks, SOS was co-expressed. Among these, SOS1 and SOS2 were upregulated, and the SOS3 and SOS5 components were downregulated. The genes of heat shock proteins and the phenylalanine pathway were upregulated in the tolerant varieties. These findings outline a tolerance mechanism model for rootstocks for coping with osmotic stress, providing important information for improving the resistance of grapes under global climate change.

Keywords: grape; rootstock; salt stress; signal transduction.


Conflict of interest statement

The authors declare no competing interest.

Figures

Figure 1
Figure 1
Differentially expressed genes (DEGs) in rootstocks. (A) Principal component analysis (PCA): scatterplot of different samples based on the transcriptomic profiles. Pink represents the P1 stage, which is the susceptibility period of intolerant varieties, blue represents the P2 period of the susceptible tolerant varieties, red represents the intolerant varieties, and black represents the tolerant varieties. (B) Comparison of the genome expression made by TBtools. In the outer circle, pink represents P1, blue represents P2, and black represents the control group. The heat map in the inner circle represents the distribution of highly expressed genes in the treatment group on the chromosomes. (C) Number of up− and downregulated DEGs in samples treated with salt from six rootstocks at two different stages (as shown in Figure 1A). (D). DEGs in samples treated with salt from six rootstocks at two different stages (as shown in Figure 1A). The Upset diagram was used to more closely represent the intersection between different temperatures and samples. The green bar graph represents the size of each combination, while a black dot represents yes, a gray dot represents none, and the black bar graph presents the number of intersections. The four−element Venn diagram was used to represent the number of genes with no difference in expression between different groups. Yellow represents DEGs during P1 in intolerant varieties, pink represents DEGs during P1 in tolerant varieties, green represents DEGs during P2 in tolerant varieties, and blue represents differences between P1 and P2 in tolerant varieties. (E). Comparison of the transcription level of DEGs using heatmap analysis.
Figure 2
Figure 2
Comparisons of the statistical overrepresentation of GO categories of the three rootstock groups under salt stress. (A) Comparison of the total of the three categories of GO enrichment between tolerant and intolerant varieties. (B) Comparison of the GO enrichment of tolerant and intolerant varieties. The specific GO terms represented by the abscissa are described in Table S3. The red box represents biological processes (BP), the green box represents cellular components (CC), and the blue box represents molecular functions (MF). (C) Visualization of the regulatory network based on the GO analysis results in GO Levels 5–8. The different GO categories are colored according to the correlation between the three groups as shown by the Venn diagram; gray indicates that a term is only enriched but has no specific clusters. Ellipses, squares, and triangles represent biological processes, cell components, and molecular functions, respectively. The size of the shape indicates the number of genes contained in it.
Figure 3
Figure 3
Kyoto Encyclopedia of Genes and Genomes (KEGG) pathways analysis of significantly enriched DEGs in rootstocks. GeneRatio represents the ratio of the number of DEGs annotated to the KEGG pathway to the total number of DEGs. Count represents the number of DEGs annotated to the KEGG pathway. padj represents the p-value corrected by multiple hypothesis testing.
Figure 4
Figure 4
(A). Numbers of differentially expressed genes in grape rootstocks grown under salt stress. IT, genes from three intolerant grape rootstock varieties in first stress period; T1, genes from three tolerant grape rootstock varieties in first stress period; T2, genes from three tolerant grape rootstock varieties in second stress period. (B). Partial least squares discriminant analysis (PLS−DA) model of the different samples made by SIMCA to analyze the scatter diagram; 1, 2, 3, and 4 represent CK, the two stages of tolerant varieties, and one stage of the intolerant varieties. (C): The o2PLS−DA load graph produced by SIMCA. (D): DEGs expression patterns and GO enrichment analysis. The right-hand diagram (+) (−) represents the positive correlations and negative correlations, and the line graph represents the expression trend in the samples.
Figure 5
Figure 5
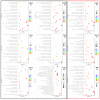
DEGs assigned to the main metabolic process, according to Mapman software. This map consists of the genes that participated in hormone-related genes, abiotic stress, biotic stress, transcription factors, and the secondary metabolism genes including implicated flavonoids, simple phenols, lignin and lignans, phenlypropanoids, and terpenoids. Blue represents upregulation; red represents downregulation.
Figure 6
Figure 6
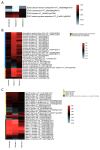
Expression analysis of DEGs related to the defense system under salt stress. Expression analysis of the DEGs involved in (A) the SOS gene family, (B) phenylpropane metabolism, and (C) the HSP gene family under the salt treatment. Each column represents a different tolerance level and each row represents a gene. Red indicates upregulated expression of a DEG and blue indicates downregulated expression. The colors on the left side of the gene are clustered by gene function.
Figure 7
Figure 7
Model of rootstocks in response to salt stress.

Similar articles

Cited by

References

    1. Bailey-Serres J., Fukao T., Gibbs D.J., Holdsworth M.J., Lee S.C., Licausi F., Perata P., Voesenek L.A., van Dongen J.T. Making sense of low oxygen sensing. Trends Plant Sci. 2012;17:129–138. doi: 10.1016/j.tplants.2011.12.004. - DOI - PubMed
    1. Keller M. Managing grapevines to optimise fruit development in a challenging environment: A climate change primer for viticulturists. Aust. J. Grape Wine Res. 2010;16:56–69. doi: 10.1111/j.1755-0238.2009.00077.x. - DOI
    1. Miras-Avalos J.M., Intrigliolo D.S. Grape Composition under Abiotic Constrains: Water Stress and Salinity. Front. Plant Sci. 2017;8:851. doi: 10.3389/fpls.2017.00851. - DOI - PMC - PubMed
    1. Hasegawa P.M., Bressan R.A., Zhu J.K., Bohnert H.J. Plant Cellular and Molecular Responses to High Salinity. Annu. Rev. Plant Physiol. Plant Mol. Biol. 2000;51:463–499. doi: 10.1146/annurev.arplant.51.1.463. - DOI - PubMed
    1. Zhu J.K. Salt and drought stress signal transduction in plants. Annu. Rev. Plant Biol. 2002;53:247–273. doi: 10.1146/annurev.arplant.53.091401.143329. - DOI - PMC - PubMed

LinkOut - more resources