

Mass Spectrometry Imaging for Spatial Chemical Profiling of Vegetative Parts of Plants
- PMID: 35567235
- PMCID: PMC9102225
- DOI: 10.3390/plants11091234
Mass Spectrometry Imaging for Spatial Chemical Profiling of Vegetative Parts of Plants
Abstract
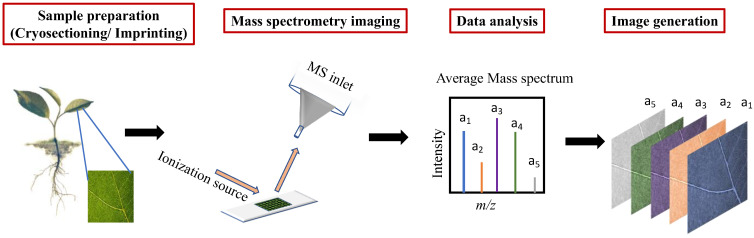
The detection of chemical species and understanding their respective localisations in tissues have important implications in plant science. The conventional methods for imaging spatial localisation of chemical species are often restricted by the number of species that can be identified and is mostly done in a targeted manner. Mass spectrometry imaging combines the ability of traditional mass spectrometry to detect numerous chemical species in a sample with their spatial localisation information by analysing the specimen in a 2D manner. This article details the popular mass spectrometry imaging methodologies which are widely pursued along with their respective sample preparation and the data analysis methods that are commonly used. We also review the advancements through the years in the usage of the technique for the spatial profiling of endogenous metabolites, detection of xenobiotic agrochemicals and disease detection in plants. As an actively pursued area of research, we also address the hurdles in the analysis of plant tissues, the future scopes and an integrated approach to analyse samples combining different mass spectrometry imaging methods to obtain the most information from a sample of interest.
Keywords: chemical imaging; mass spectrometry; plant.
Conflict of interest statement
The authors declare no conflict of interest.
Figures
Similar articles
-
[Research advances in imaging technology for food safety and quality control].Se Pu. 2020 Jul 8;38(7):741-749. doi: 10.3724/SP.J.1123.2020.03015. Se Pu. 2020. PMID: 34213280 Review. Chinese.
-
Biosynthesis-based spatial metabolome of Salvia miltiorrhiza Bunge by combining metabolomics approaches with mass spectrometry-imaging.Talanta. 2022 Feb 1;238(Pt 2):123045. doi: 10.1016/j.talanta.2021.123045. Epub 2021 Nov 9. Talanta. 2022. PMID: 34801902
-
Recent advances in matrix-assisted laser desorption/ionisation mass spectrometry imaging (MALDI-MSI) for in situ analysis of endogenous molecules in plants.Phytochem Anal. 2018 Jul;29(4):351-364. doi: 10.1002/pca.2759. Epub 2018 Apr 17. Phytochem Anal. 2018. PMID: 29667236 Review.
-
Mass spectrometry imaging for direct visualization of components in plants tissues.J Sep Sci. 2021 Sep;44(18):3462-3476. doi: 10.1002/jssc.202100138. Epub 2021 Jul 18. J Sep Sci. 2021. PMID: 34245221 Review.
-
LAESI mass spectrometry imaging as a tool to differentiate the root metabolome of native and range-expanding plant species.Planta. 2018 Dec;248(6):1515-1523. doi: 10.1007/s00425-018-2989-4. Epub 2018 Aug 23. Planta. 2018. PMID: 30140978 Free PMC article.
Cited by
-
Identification of Plant Compounds with Mass Spectrometry Imaging (MSI).Metabolites. 2024 Jul 30;14(8):419. doi: 10.3390/metabo14080419. Metabolites. 2024. PMID: 39195515 Free PMC article. Review.
-
Phytochemistry, Pharmacological Potential, and Ethnomedicinal Relevance of Achillea nobilis and Its Subspecies: A Comprehensive Review.Molecules. 2025 Jun 4;30(11):2460. doi: 10.3390/molecules30112460. Molecules. 2025. PMID: 40509346 Free PMC article. Review.
-
Analysis of carbohydrates and glycoconjugates by matrix-assisted laser desorption/ionization mass spectrometry: An update for 2021-2022.Mass Spectrom Rev. 2025 May-Jun;44(3):213-453. doi: 10.1002/mas.21873. Epub 2024 Jun 24. Mass Spectrom Rev. 2025. PMID: 38925550 Free PMC article. Review.
-
Visualizing active fungicide formulation mobility in tomato leaves with desorption electrospray ionisation mass spectrometry imaging.Analyst. 2024 Dec 2;149(24):5904-5913. doi: 10.1039/d4an01309c. Analyst. 2024. PMID: 39575682 Free PMC article.
References
Publication types
Grants and funding
LinkOut - more resources
Full Text Sources
Research Materials
