. 2022 Aug;77(8):2468-2481.
doi: 10.1111/all.15372. Epub 2022 Jun 2.

T-cell recovery and evidence of persistent immune activation 12 months after severe COVID-19

Affiliations

T-cell recovery and evidence of persistent immune activation 12 months after severe COVID-19

Patrick Taeschler et al. Allergy. 2022 Aug.

Abstract

Background: T-cell lymphopenia and functional impairment is a hallmark of severe acute coronavirus disease 2019 (COVID-19). How T-cell numbers and function evolve at later timepoints after clinical recovery remains poorly investigated.

Methods: We prospectively enrolled and longitudinally sampled 173 individuals with asymptomatic to critical COVID-19 and analyzed phenotypic and functional characteristics of T cells using flow cytometry, 40-parameter mass cytometry, targeted proteomics, and functional assays.

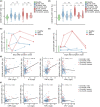
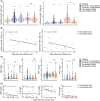
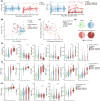
Results: The extensive T-cell lymphopenia observed particularly in patients with severe COVID-19 during acute infection had recovered 6 months after infection, which was accompanied by a normalization of functional T-cell responses to common viral antigens. We detected persisting CD4+ and CD8+ T-cell activation up to 12 months after infection, in patients with mild and severe COVID-19, as measured by increased HLA-DR and CD38 expression on these cells. Persistent T-cell activation after COVID-19 was independent of administration of a COVID-19 vaccine post-infection. Furthermore, we identified a subgroup of patients with severe COVID-19 that presented with persistently low CD8+ T-cell counts at follow-up and exhibited a distinct phenotype during acute infection consisting of a dysfunctional T-cell response and signs of excessive pro-inflammatory cytokine production.

Conclusion: Our study suggests that T-cell numbers and function recover in most patients after COVID-19. However, we find evidence of persistent T-cell activation up to 12 months after infection and describe a subgroup of severe COVID-19 patients with persistently low CD8+ T-cell counts exhibiting a dysregulated immune response during acute infection.

Keywords: COVID-19; SARS-CoV-2; T cells; follow-up; recovery.


Conflict of interest statement

Dr. Taeschler, Dr. Chevrier, Ms. Hasler, Dr. Baechli, Dr. Rudiger, Dr. Stüssi‐Helbling, Dr. Huber, and Dr. Deng have nothing to disclose. Dr. Adamo reports grants from Swiss Academy of Medical Sciences and University of Zurich, during the conduct of the study. Dr. Cervia reports grants from Swiss Academy of Medical Sciences, during the conduct of the study. Mr. Zurbuchen reports grants from Swiss Academy of Medical Sciences, during the conduct of the study. Dr. Raeber reports a Young Talents in Clinical Research Project Grant by the Swiss Academy of Medical Sciences and the G. & J. Bangerter‐Rhyner Foundation, during the conduct of the study. Dr. Bodenmiller reports grants from Swiss National Science Foundation, grants from Pandemic Fund of the University of Zurich, during the conduct of the study. Dr. Boyman reports grants from Swiss National Science Foundation, grants from Clinical Research Priority Program of University of Zurich, and an Innovation grant of University Hospital Zurich, during the conduct of the study. Dr. Nilsson reports grants from Swiss National Science Foundation, during the conduct of the study.

Figures

FIGURE 1
FIGURE 1
Quantitative and functional recovery of T‐cell subsets after acute COVID‐19. (A) Study overview. (B, C) Counts of peripheral lymphocyte subsets obtained by flow cytometry in healthy controls (n = 41), during acute COVID‐19 (n = 167), at 6‐month (n = 111) and at 12‐month follow‐up (n = 90) (B), or in individuals that were sampled prior and after SARS‐CoV‐2 infection (C; n = 5). (D, E) Peripheral leukocyte counts obtained by complete blood count, in the whole study cohort (healthy, n = 37; acute, n = 153; 6‐months, n = 111; 12‐month, n = 90) (D), or in patients with pre‐infection samples (E; n = 5). (F, G) Functional T‐cell responses as assessed by CD3+ T‐cell stimulation in FASCIA, after stimulation with the indicated viral antigen, during acute COVID‐19 (F; healthy, n = 25, mild, n = 46; severe, n = 58) and at 6‐month follow‐up (G; healthy, n = 10; mild, n = 33; severe, n = 30). All p‐values were obtained by Mann–Whitney U‐tests and adjusted for multiple comparisons by the Holm method. p‐values without brackets (B, D) indicate comparison to healthy controls. Horizontal bars in violin plots represent medians. ns, non‐significant; *, p < .05; **, p < .01; ***, p < .001; ****, p < .0001. CMV, cytomegalovirus; HSV, herpes simplex virus; VZV, varizella zoster virus
FIGURE 2
FIGURE 2
Persistent T‐cell activation 12 months after acute COVID‐19. (A–D) Frequency of activated (CD38+HLA‐DR+) CD4+ (A, C) and CD8+ (B, D) T cells in the whole study cohort (healthy, n = 41; acute, n = 167; 6 months, n = 111; 12 months, n = 90) (A, B), or in individuals that were sampled prior to SARS‐CoV‐2 infection (C, D; n = 5). p‐values in (A and B) were obtained by Mann–Whitney U‐tests and adjusted for multiple comparisons by the Holmes method. p‐values without brackets indicate comparison to healthy controls. Horizontal lines in violin plots indicate medians. (E, F) Correlation of activated (CD38+HLA‐DR+) CD4+ (E) and CD8+ T (F) cells with inflammation markers, that is, CRP (n = 151), IL‐6 (n = 201), TNF‐α (n = 201), and IFN‐γ (n = 201), at 6‐month or 12‐month follow‐up. Regression lines represent simple linear regression models, with Pearson’s correlation coefficient calculated for all observations
FIGURE 3
FIGURE 3
Immune activation following mRNA‐based COVID‐19 vaccination. (A) Frequency of activated (CD38+HLA‐DR+) CD4+ and CD8+ T cells in healthy controls (n = 41) and followed up COVID‐19 patients grouped according to their vaccination status, that is, unvaccinated (6 months, n = 100; 12 months, n = 33) or vaccinated (≤30d before sampling, n = 21; >30d before sampling, n = 47). (B) Temporal association of activated CD4+ and CD8+ T cells following vaccination, in followed up COVID‐19 patients that were vaccinated within 30 days prior to sampling (n = 21). Regression lines represent simple linear regression models, starting from 5 days after the last vaccine shot, with Pearson’s correlation coefficient calculated for n = 19 observations. (C) Inflammation markers, that is, CRP (n = 188), IL‐6 (n = 243), TNF‐α (n = 243), and IFN‐γ (n = 243), in healthy controls or followed up COVID‐19 patients grouped according to their vaccination status and sampling timepoint. (D) Temporal trajectories of inflammation markers following mRNA vaccination in followed up COVID‐19 patients that were vaccinated within 30 days prior to sampling (n = 21). Regression lines represent simple linear regression models, with Pearson’s correlation coefficient calculated for all observations. Horizontal bars in violin plots represent medians. p‐values in (A and C) were calculated using Mann–Whitney U‐tests, and adjusted for multiple comparison using the Holm method. p‐values without brackets represent comparisons to healthy controls. ns, non‐significant; *, p < .05; **, p < .01; ***, p < .001; ****, p < .0001
FIGURE 4
FIGURE 4
Persistent peripheral CD8+ T‐cell lymphopenia in a subgroup recovering from severe COVID‐19. (A) Temporal trajectories of peripheral CD4+ and CD8+ T‐cell counts in COVID‐19 patients during acute infection (n = 167), and at 6‐month (n = 111) and 12‐month (n = 90) follow‐up, separating patients with mild vs. severe COVID‐19. Regression lines indicate separate simple linear regression models, with Pearson’s correlation coefficient R. The CD8‐low subgroup (n = 10) was defined as patients with severe disease that presented with CD8+ counts below 250/μl at the 6‐month follow‐up. (B) Principal component analysis (PCA) including 131 parameters during acute COVID‐19 (Table S1). Each dot represents an individual study participant, including healthy controls (n = 27) and acute COVID‐19 patients (n = 127). (C) Loadings of PCA depicted in (B), with each parameter shown as an individual dot. Colors indicate group of participants with higher mean for each parameter. Dot sizes indicate p‐values of the difference, as calculated by Mann–Whitney U‐test (Table S1 and Figure S3B) (D) Sex distribution in healthy individuals (n = 42), and mild (n = 109) and severe (n = 36) COVID‐19 patients, dividing severe COVID‐19 patients into subgroups based on CD8+ T‐cell counts at 6‐month follow‐up. (E, F) Selected parameters, of PCA in (B, C), comparing severe acute COVID‐19 patients of CD8‐high and CD8‐low subgroups. (G) Selected inflammation markers and peripheral leukocyte counts in healthy controls and COVID‐19 patients at 6‐month follow‐up, comparing severe COVID‐19 patients of CD8‐high (n = 26) and CD8‐low (n = 10) subgroups. p‐values in (E–G) were calculated using Mann–Whitney U‐test. Horizontal lines in violin plots indicate medians. ns, non‐significant; *, p < .05; **, p < .01; ***, p < .001; ****, p < .0001
FIGURE 5
FIGURE 5
Phenotypic perturbations of CD8+ T cells in the CD8‐low subgroup of severe COVID‐19 patients. (A) Frequencies of CD4+ regulatory cells as well as proliferating, activated, exhausted and apoptotic CD4+ and CD8+ T cells, as obtained by mass cytometry, comparing mild (n = 17) to severe CD8‐high (n = 14) and severe CD8‐low (n = 5) acute COVID‐19 patients. (B) Correlation matrix of T‐cell phenotypes (vertical axis) with age, routine laboratory testing and serum proteomics (horizontal axis), including data from 15 mild and 27 severe acute COVID‐19 patients. Dot sizes and colors correspond to Spearman’s correlation coefficient, with significance indicated by asterisks. (C) Frequencies of CD4+ regulatory cells as well as proliferating, activated, exhausted and apoptotic CD4+ and CD8+ T cells, as obtained by mass cytometry, comparing mild (n = 19) to severe CD8‐high (n = 19) and severe CD8‐low (n = 8) COVID‐19 patients at 6 months follow‐up. p‐values in (A and C) were obtained using Mann–Whitney U‐tests and adjusted for multiple comparisons using the Holm method. Horizontal lines in violin plots indicate medians. ns, non‐significant; *, p < .05; **, p < .01; ***, p <.001; ****, p < .0001. reg, regulatory; CM, central memory; EM, effector memory; TEMRA, terminally differentiated EM

References

    1. Arons MM, Hatfield KM, Reddy SC, et al. Presymptomatic SARS‐CoV‐2 infections and transmission in a skilled nursing facility. N Eng J Med. 2020;382(22):2081‐2090. - PMC - PubMed
    1. Tong Z‐D, Tang A, Li K‐F, et al. Potential presymptomatic transmission of SARS‐CoV‐2, Zhejiang province, China, 2020. Emerg Infect Dis. 2020;26(5):1052‐1054. - PMC - PubMed
    1. Li R, Pei S, Chen B, et al. Substantial undocumented infection facilitates the rapid dissemination of novel coronavirus (SARS‐CoV‐2). Science. 2020;368(6490):489‐493. - PMC - PubMed
    1. Wu Z, McGoogan JM. Characteristics of and important lessons from the coronavirus disease 2019 (COVID‐19) outbreak in China: summary of a report of 72 314 cases from the Chinese center for disease control and prevention. JAMA. 2020;323(13):1239‐1242. - PubMed
    1. Yang X, Yu Y, Xu J, et al. Clinical course and outcomes of critically ill patients with SARS‐CoV‐2 pneumonia in Wuhan, China: a single‐centered, retrospective, observational study. Lancet Respir Med. 2020;8(5):475‐481. - PMC - PubMed

Publication types

Substances

Supplementary concepts