. 2022 Jun;21(6):e13617.
doi: 10.1111/acel.13617. Epub 2022 May 14.

Alzheimer's disease associated AKAP9 I2558M mutation alters posttranslational modification and interactome of tau and cellular functions in CRISPR-edited human neuronal cells

Affiliations

Alzheimer's disease associated AKAP9 I2558M mutation alters posttranslational modification and interactome of tau and cellular functions in CRISPR-edited human neuronal cells

Yang You et al. Aging Cell. 2022 Jun.

Abstract

Alzheimer's disease (AD) is a pervasive neurodegeneration disease with high heritability. In this study, we employed CRISPR-Cas9-engineered technology to investigate the effects of a rare mutation (rs144662445) in the A kinase anchoring protein 9 (AKAP9) gene, which is associated with AD in African Americans (AA), on tau pathology and the tau interactome in SH-SY5Y P301L neuron-like cells. The mutation significantly increased the level of phosphorylated tau, specifically at the site Ser396/Ser404. Moreover, analyses of the tau interactome measured by affinity purification-mass spectrometry revealed that differentially expressed tau-interacting proteins in AKAP9 mutant cells were associated with RNA translation, RNA localization and oxidative activity, recapitulating the tau interactome signature previously reported with human AD brain samples. Importantly, these results were further validated by functional studies showing a significant reduction in protein synthesis activity and excessive oxidative stress in AKAP9 mutant compared with wild type cells in a tau-dependent manner, which are mirrored with pathological phenotype frequently seen in AD. Our results demonstrated specific effects of rs14462445 on mis-processing of tau and suggest a potential role of AKAP9 in AD pathogenesis.

Keywords: Alzheimer's disease; CRISPR; Tau; Tau interactome; a kinase anchoring protein 9; oxidative stress; phosphorylated tau; protein synthesis; proteomics.


Conflict of interest statement

The authors declare no conflicts of interest.

Figures
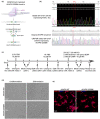
FIGURE 1
FIGURE 1
CRISPR‐mediated knock‐in of AKAP9 I2558 M mutation in SH‐SY5Y P301L cells and neuronal differentiation. (a) The scheme of generating AKAP9 I2558 M mutation by CRISPR/Cas9‐mediated knock‐in. The original nucleotide A‐T was replaced with the donor sequence expressing G‐C. (b) Sanger sequencing of SH‐SY5Y P301L cell line and the knock‐in of AKAP9 I2558 M mutation. The red rectangles show targeted sequences. (c) Timetable of SH‐SY5Y cells differentiation into neuronal cells. FBS, fetal bovine serum; RA, retinoic acid; BDNF, brain‐derived neurotrophic factor; db‐cAMP, dibutyryl cyclic AMP. (d) Bright field images of undifferentiated and differentiated SH‐SY5Y cells. Undifferentiated SH‐SY5Y cells have a flat phenotype with few projections while differentiated SH‐SY5Y neurons demonstrate extensive and elongated neuritic projections. Scale bar, 100 μm. (e) Representative immunofluorescent images of fully differentiated SH‐SY5Y cells by staining with neuronal‐specific marker MAP2 in AKAP9 WT and AKAP9 I2558 M group. Scale bar, 75 μm
FIGURE 2
FIGURE 2
AKAP9 I2558 M mutation significantly enhances tau phosphorylation level in SH‐SY5Y P301L neurons. (a) Representative images of rolipram‐treated and untreated SH‐SY5Y neurons with AKAP9 WT and AKAP9 I2558 M by immunostaining for p‐tau with PHF1 (Ser396/Ser404) antibody and neuronal marker with MAP2 antibody. Scale bar, 100 μm. (b) Quantification of the fluorescence intensity of PHF1 positive staining in AKAP9 WT and AKAP9 I2558 M group. N = 3 independent experiments. (c) Levels of pS396 Tau/total Tau in AKAP9 WT and AKAP9 I2558 M group measured by quantitative ELISA. N = 3 independent experiments. Data are presented as the mean ±SEM, *p < 0.05, **p < 0.01, using two‐way ANOVA to compare between the groups with two factors (AKAP9 genotype and rolipram treatment). (d) Western blotting analysis of tau and related proteins in AKAP9 WT and I2558 M cells. Band intensity was normalized by β‐actin. N = 3 replicates. PPP2CB, protein phosphatase 2 catalytic subunit β. Data are presented as the mean ±SEM, ns, no significance, *p < 0.05, using unpaired t test
FIGURE 3
FIGURE 3
Tau interactome analyses in SH‐SY5Y P301L neurons with AKAP9 WT and AKAP9 I2558 M mutation by label‐free quantitative mass spectrometry. (a) The workflow of Tau‐IP proteomics study. Immunoprecipitation of tau‐interacting proteins in AKAP9 WT and AKAP9 I2558 M cells was performed by incubating total cell lysates with tau‐13 antibody or mouse IgG conjugated beads. The immunoprecipitated proteins were then digested and proceeded for mass spectrometry. N = 5 replicates for AKAP9 WT and AKAP9 I2558 M group; N = 3 replicates for mIgG group. (b) Immunoprecipitation of tau protein from SH‐SY5Y P301L cell lysates with tau‐13 antibody was confirmed by Western blot analysis. (c) Venn diagram of tau‐interacting proteins for AKAP9 WT and AKAP9 I2558 M cells identified by Tau‐IP proteomics. To show the reproducibility among samples, proteins represented in at least three out of five replicates from AKAP9 WT and AKAP9 I2558 M group, and two out of three replicates from mIgG group were selected (Table S1). (d) Volcano plot of the common proteins for tau interactome between AKAP9 WT and AKAP9 I2558 M groups. Y axis of the plot represents significance (‐log10 of p value) and the x axis shows the log2 of the fold change (expression in AKAP9 I2558 M/expression in AKAP9 WT). The red dots represent the proteins that are significantly upregulated in the AKAP9 I2558 M cells compared with AKAP9 WT, whereas the green dots represent the proteins that are significantly downregulated. The fold changes of proteins not statistically significant are represented as black dots. The dashed blue lines represent a criteria of p < 0.05 (‐log10 (p value) >1.3) and fold change >2 (log2 FC >1 or <−1). The proteins met with the criteria are indicated. (E) Heatmap of total 26 differentially expressed proteins (DEPs) in AKAP9 WT and 153 DEPs in AKAP9 I2558 M group using quantitative iBAQ value, with depletion depicted in blue and enrichment in red
FIGURE 4
FIGURE 4
Post‐translational modifications (PTMs) identified to be present on Tau by mass spectrometry. Plot shows proportions of reads for PTMs out of total at each amino acid in the full‐length 441 amino acid isoform of tau protein in AKAP9 WT and AKAP9 I2558 M cells. All data are presented as the mean ±SEM, *p < 0.05, using unpaired t‐test. Phosphorylated residues recognized by PHF1 (Ser396/Ser404) are shown in red rectangles
FIGURE 5
FIGURE 5
Functional enrichment analysis of DEPs in AKAP9 I2558 M group versus AKAP9 WT group. (a) Bar graph of the statistically enriched terms in gene ontology and reactome pathway across input proteins via the Metascape software. Total 26 DEPs in AKAP9 WT and 153 DEPs in AKAP9 I2558 M group were input. (b) Network layout of the enriched terms for DEPs of AKAP9 WT and AKAP9 I2558 M group. The size of a node is proportional to the number of input genes that fall into that term, and the respective color represents its cluster identity. Terms with a Kappa‐statistical similarity score >0.3 are linked by an edge (the thickness of the edge represents the similarity score). (c) Protein–protein interaction (PPI) network and MCODE components identified in the DEPs of AKAP9 I2558 M. MCODE algorithm was applied to PPI network to identify neighborhoods where proteins are densely connected. Each MCODE network is assigned a unique color. GO enrichment analysis was applied to each MCODE network to assign “meanings” to the network component. The red represents protein network involved in translation; the blue represents protein network involved in RNA localization; the green represents protein network involved in oxidative activity
FIGURE 6
FIGURE 6
AKAP9 I2558 M mutation significantly inhibits the nascent protein synthesis in SH‐SY5Y P301L neurons compared with AKAP9 WT in a Tau‐dependent manner. (a) The scheme of protein synthesis assay. 1% DMSO or 0.01 mg/ml CHX (Cyclohexamide, protein synthesis inhibitor) were added to SH‐SY5Y P301L neurons and incubated for 16 h. Evaluation of protein synthesis was performed by using Click‐iT protein synthesis kit according to the manufacturer's instructions. (b) Representative fluorescent images of nascent proteins labeled by Alexa Flour 488 picolyl azide in AKAP9 WT and AKAP9 I2558 M cells. Scale bar, 100 μm and 25 μm. (c) Quantification of the fluorescence intensity of Alexa Flour 488 positive staining in AKAP9 WT and AKAP9 I2558 M group. N = 3 independent experiments. (d) The scheme of protein synthesis assay with siRNA treatment. 10 nM NC‐ or MAPT‐siRNA were added to day 14 SH‐SY5Y P301L neurons and incubated for 6 h followed by refreshing media and culturing until day 18. Evaluation of protein synthesis was performed by using Click‐iT protein synthesis kit according to the manufacturer's instructions. (e) Representative fluorescent images of nascent proteins labeled by Alexa Flour 488 picolyl azide in AKAP9 WT and AKAP9 I2558 M cells with either NC‐siRNA or MAPT‐siRNA treatment. Scale bar, 50 μm and 10 μm. (f) Quantification of the fluorescence intensity of Alexa Flour 488 positive staining normalized by DAPI staining in AKAP9 WT and AKAP9 I2558 M group. N = 3 independent experiments. Data are presented as the mean ±SEM, ns., no significance, ****p < 0.0001, using two‐way ANOVA with Sidak's multiple comparisons
FIGURE 7
FIGURE 7
Elevated oxidative stress in SH‐SY5Y P301L neurons with AKAP9 I2558 M mutation in a Tau‐dependent manner. (a) The scheme of measuring reactive oxygen species (ROS) in SH‐SY5Y P301L neurons. SH‐SY5Y neurons were incubated with Vehicle (VEH) or 50 μM N‐acetyl cysteine (NAC, ROS inhibitor) for 1 h before labeling with CellRox Orange Reagent. The ROS level was tracked and analyzed by using live cell tracking instrument (Incucyte). (b) Representative images of ROS signal labeled by CellRox Orange in AKAP9 WT and AKAP9 I2558 M cells. Scale bar, 200 μm. (c) Quantification of the fluorescence intensity of CellRox Orange in AKAP9 WT and AKAP9 I2558 M group. N = 2 independent experiments. All data are presented as the mean ±SEM, *p < 0.05, using two‐way ANOVA with Sidak's multiple comparisons. (d) Representative images of ROS signal labeled by CellRox Green in AKAP9 WT and AKAP9 I2558 M cells with either NC‐ or MAPT‐siRNA treatment. 10 nM NC‐ or MAPT‐siRNA were added to day 14 SH‐SY5Y P301L neurons and incubated for 6 h followed by refreshing media and culturing until day 18. The ROS level was labeled by CellRox Green reagent and fixed for analyzing by confocal microscopy. Scale bar, 20 μm. (e) Quantification of the fluorescence intensity of CellRox Orange in AKAP9 WT and AKAP9 I2558 M group. N = 2 independent experiments. All data are presented as the mean ±SEM, *p < 0.05, **p < 0.01, ***p < 0.001 using two‐way ANOVA with Sidak's multiple comparisons

References

    1. Agholme, L. , Lindstrom, T. , Kagedal, K. , Marcusson, J. , & Hallbeck, M. (2010). An in vitro model for neuroscience: differentiation of SH‐SY5Y cells into cells with morphological and biochemical characteristics of mature neurons. Journal of Alzheimer's Disease, 20, 1069–1082. 10.3233/JAD-2010-091363 - DOI - PubMed
    1. Cavallini, A. , Brewerton, S. , Bell, A. , Sargent, S. , Glover, S. , Hardy, C. , Moore, R. , Calley, J. , Ramachandran, D. , Poidinger, M. et al (2013). An unbiased approach to identifying tau kinases that phosphorylate tau at sites associated with Alzheimer disease. Journal of Biological Chemistry, 288, 23331–23347. 10.1074/jbc.M113.463984 - DOI - PMC - PubMed
    1. Cheignon, C. , Tomas, M. , Bonnefont‐Rousselot, D. , Faller, P. , Hureau, C. , & Collin, F. (2018). Oxidative stress and the amyloid beta peptide in Alzheimer's disease. Redox Biology, 14, 450–464. 10.1016/j.redox.2017.10.014 - DOI - PMC - PubMed
    1. Combs, B. , Hamel, C. , & Kanaan, N. M. (2016). Pathological conformations involving the amino terminus of tau occur early in Alzheimer's disease and are differentially detected by monoclonal antibodies. Neurobiology of Diseases, 94, 18–31. 10.1016/j.nbd.2016.05.016 - DOI - PMC - PubMed
    1. de Calignon, A. , Polydoro, M. , Suarez‐Calvet, M. , William, C. , Adamowicz, D. H. , Kopeikina, K. J. , Pitstick, R. , Sahara, N. , Ashe, K. H. , Carlson, G. A. , Spires‐Jones, T. L. , & Hyman, B. T. (2012). Propagation of tau pathology in a model of early Alzheimer's disease. Neuron, 73, 685–697. 10.1016/j.neuron.2011.11.033 - DOI - PMC - PubMed

Publication types

LinkOut - more resources