. 2023 Jan 1;77(1):77-91.
doi: 10.1002/hep.32573. Epub 2022 Jun 17.

Multiomics identifies the link between intratumor steatosis and the exhausted tumor immune microenvironment in hepatocellular carcinoma

Affiliations

Multiomics identifies the link between intratumor steatosis and the exhausted tumor immune microenvironment in hepatocellular carcinoma

Hiroki Murai et al. Hepatology. .

Abstract

Background and aims: Immunotherapy has become the standard-of-care treatment for hepatocellular carcinoma (HCC), but its efficacy remains limited. To identify immunotherapy-susceptible HCC, we profiled the molecular abnormalities and tumor immune microenvironment (TIME) of rapidly increasing nonviral HCC.

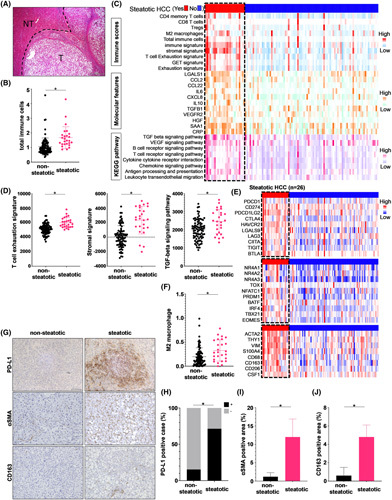
Approaches and results: We performed RNA-seq of tumor tissues in 113 patients with nonviral HCC and cancer genome sequencing of 69 genes with recurrent genetic alterations reported in HCC. Unsupervised hierarchical clustering classified nonviral HCCs into three molecular classes (Class I, II, III), which stratified patient prognosis. Class I, with the poorest prognosis, was associated with TP53 mutations, whereas class III, with the best prognosis, was associated with cadherin-associated protein beta 1 (CTNNB1) mutations. Thirty-eight percent of nonviral HCC was defined as an immune class characterized by a high frequency of intratumoral steatosis and a low frequency of CTNNB1 mutations. Steatotic HCC, which accounts for 23% of nonviral HCC cases, presented an immune-enriched but immune-exhausted TIME characterized by T cell exhaustion, M2 macrophage and cancer-associated fibroblast (CAF) infiltration, high PD-L1 expression, and TGF-β signaling activation. Spatial transcriptome analysis suggested that M2 macrophages and CAFs may be in close proximity to exhausted CD8+ T cells in steatotic HCC. An in vitro study showed that palmitic acid-induced lipid accumulation in HCC cells upregulated PD-L1 expression and promoted immunosuppressive phenotypes of cocultured macrophages and fibroblasts. Patients with steatotic HCC, confirmed by chemical-shift MR imaging, had significantly longer PFS with combined immunotherapy using anti-PD-L1 and anti-VEGF antibodies.

Conclusions: Multiomics stratified nonviral HCCs according to prognosis or TIME. We identified the link between intratumoral steatosis and immune-exhausted immunotherapy-susceptible TIME.


Conflict of interest statement

Hayato Hikita, Takahiro Kodama and Tetsuo Takehara are on the speakers' bureau for Chugai Pharmaceutical Co., Ltd.

Figures

None
Graphical abstract
FIGURE 1
FIGURE 1
Multiomics classifies nonviral HCCs into three prognostically stratified subgroups. (A) Transcriptomic classification of nonviral HCCs. Unsupervised hierarchical clustering analysis of gene expression identified three classes: Class I (blue, n = 36), Class II (red, n = 46), and Class III (green, n = 31). Clinicopathological features are shown with missing values in white. The panel of molecular features is a heatmap displaying the relative expression levels of representative genes for each cluster. The panel of molecular classifications is a heatmap displaying the comparison of aggregate scores with gene sets associated with the previously defined molecular classifications. DM, DL, HT, and PV represent diabetes mellitus, dyslipidemia, hypertension, and portal vein, respectively. (B) Kaplan–Meier analysis of patients stratified by molecular class (* p < 0.05, Class I vs. Class II and Class III vs. others). (C) Cancer genome sequence analysis of 55 nonviral HCC patients. Only genes with a mutation frequency of 5% or more are presented in the order of molecular subtype. The results of all the genes are presented in Figure S5. (D) Kaplan–Meier analysis of patients with nonviral HCC stratified by genomic abnormality (*p < 0.05, TP53 vs. cadherin‐associated protein beta 1 [CTNNB1]).
FIGURE 2
FIGURE 2
Classification of nonviral HCCs based on the TIME. (A) NTP analysis of tumor transcriptomes identified 43 out of 113 tumors as immune class in nonviral HCCs. The panel of CIBERSORT is a heatmap displaying the estimated infiltrating scores of each immune cell. The panel of three classes is a heatmap displaying the comparison with the unsupervised hierarchical clustering shown in Figure 1A. Genomic features and clinicopathological features are shown with missing values in white. (B) Comparison of the CIBERSORT score for total immune cells and cytotoxic T cells between the immune class and the other. (*p < 0.05). (C) Comparison of the percentage of each molecular class between the immune class and the other. The immune class had a significantly higher percentage of Class II (*p < 0.05). (D) Comparison of the percentage of cadherin‐associated protein beta 1 (CTNNB1) or TP53 mutations between the immune class and the other (*p < 0.05). (E) Comparison of the CIBERSORT score for total immune cells between HCCs with and without CTNNB1 mutation (*p < 0.05).
FIGURE 3
FIGURE 3
Steatotic HCC presents an immune‐enriched but immune‐exhausted TIME. (A) A representative image of steatotic HCC. T and NT stand for tumor and nontumor, respectively. (B) Comparison of the CIBERSORT score for total immune cells between steatotic and nonsteatotic HCC samples (*p < 0.05). (C) Twenty‐six out of 113 cases were identified as steatotic HCC. The panel of immune scores is a heatmap displaying the enrichment scores of immune‐related gene signatures and the CIBERSORT scores. The panel of molecular features is a heatmap displaying the relative expression levels of representative genes enhanced in steatotic HCC. The panel of KEGG pathways is a heatmap displaying the enrichment scores of representative signaling pathways enhanced in steatotic HCC. (D) Comparison of the enrichment scores for the T cell exhaustion signature, stromal signature, and TGF‐beta signaling pathway between steatotic and nonsteatotic HCC samples (*p < 0.05). (E) Heatmap displaying the relative expression levels of representative genes for inhibitory immune checkpoint molecules (top), transcription factors involved in T cell exhaustion (middle) and markers of cancer‐associated fibroblasts (CAFs) and M2 macrophages (bottom). (F) Comparison of the CIBERSORT score for M2 macrophages between steatotic and nonsteatotic HCC samples (*p < 0.05). (G) Representative images of immunohistochemistry staining for PD‐L1, αSMA and CD163. (H‐J) Comparison of the percentage of PD‐L1‐positive HCC samples (H) and positive areas of αSMA (I) and CD163 (J) staining between steatotic HCC and nonsteatotic HCC (n = 5–13 samples per group, *p < 0.05).
FIGURE 4
FIGURE 4
Exhausted T cells, M2 macrophages, and cancer‐associated fibroblasts (CAFs) interact in close proximity and constitute the immune‐exhausted TIME in steatotic HCC. (A) Graph‐based clustering of spatial transcriptomic data of steatotic HCC tissue in the Visium platform. (B) Heatmap of transcriptomic data by cluster. The graph‐based hierarchical clustering analysis divided all the spots into six clusters. (C) Enrichment scores for the immune signature, stromal signature and T cell exhaustion signature in each cluster (*p < 0.05, cluster 2 vs. others). (D) A pie chart showing the percentage of exhausted cytotoxic T‐lymphocyte (CTL) spots defined as CD8A‐positive and NR4A1‐positive in each cluster. (E) Location of the spots containing exhausted CTLs on the section. (F) Violin plots displaying the expression levels of M2 macrophage markers, CAF markers and TGFB1 in the exhausted CTL spots and the rest (*p < 0.05).
FIGURE 5
FIGURE 5
PA‐induced lipid accumulation in tumor cells may promote immunosuppression in steatotic HCC. (A) BODIPY‐stained images in Hep3B cells 24 h after bovine serum albumin (BSA) or palmitic acid (PA) supplementation. (B) Relative mRNA levels of CD274 in Hep3B cells 24 h after BSA or PA supplementation (n = 3 each and *p < 0.05). (C) Flow cytometry analysis of CD274 protein levels in Hep3B cells 24 h after BSA or PA supplementation shown as a histogram (left) and mean fluorescence intensity (MFI) (right) (n = 3 each and *p < 0.05). (D) Relative mRNA levels of Colony Stimulating Factor 1 (CSF1), C‐X‐C Motif Chemokine Ligand 8 (CXCL8) and TGFB1 in Hep3B cells 24 h after BSA or PA supplementation (n = 3 samples each and *p < 0.05). (E) Secreted levels of the CSF1, CXCL8 and TGF‐β1 proteins in the supernatant of Hep3B cells 24 h after BSA or PA supplementation (n = 3 samples each and *p < 0.05). (F) Relative CD206 and IL10 mRNA levels in macrophages after 3 days of coculture with BSA‐ or PA‐supplemented Hep3B cells (n = 3 samples each and *p < 0.05). (G) Relative TGFB1 mRNA levels in LX‐2 cells after 3 days of coculture with BSA‐ or PA‐supplemented Hep3B cells (n = 3 samples each and *p < 0.05). (H) Relative CD274, CSF1, CXCL8, TGFB1, CD206, and IL10 mRNA levels in steatotic and nonsteatotic HCC samples (*p < 0.05).
FIGURE 6
FIGURE 6
Patients with steatotic HCC are susceptible to combined immunotherapy using atezolizumab plus bevacizumab. (A,B) Representative MR and HE images of steatotic HCC. (A) A1; In‐phase T1‐weighted gradient‐echo MR image shows a well‐defined hyperintense mass just below the diaphragm aspect of hepatic segment VIII (arrow). A2; Opposed‐phase T1‐weighted gradient‐echo MR image corresponding to A1 reveals a drop in the signal intensity of the tumor (arrow). A3; Hepatic arterial phase of gadolinium ethoxybenzyl diethylenetriamine pentaacetic acid (Gd‐EOB‐DTPA)‐enhanced MR image shows arterial enhancement of the tumor (arrow). A4; 20‐min hepatobiliary phase of Gd‐EOB‐DTPA–enhanced MR image reveals a drop in the signal intensity of the tumor (arrow). (B) HE images of the tumor biopsy specimen. (C) Kaplan–Meier analysis of the PFS of patients stratified by the presence or absence of steatosis in HCC (*p < 0.05).

Comment in

References

    1. Bray F, Ferlay J, Soerjomataram I, Siegel RL, Torre LA, Jemal A. Global cancer statistics 2018: GLOBOCAN estimates of incidence and mortality worldwide for 36 cancers in 185 countries. CA Cancer J Clin. 2018;68:394–424. doi: 10.3322/caac.21492 - DOI - PubMed
    1. Paradis V. Histopathology of hepatocellular carcinoma. Recent Results Cancer Res. 2013;190:21–32. - PubMed
    1. Kanwal F, Singal AG. Surveillance for hepatocellular carcinoma: current best practice and future direction. Gastroenterology. 2019;157:54–64. - PMC - PubMed
    1. Cazzagon N, Trevisani F, Maddalo G, Giacomin A, Vanin V, Pozzan C, et al. . Rise and fall of HCV‐related hepatocellular carcinoma in Italy: a long‐term survey from the ITA.LI.CA centres. Liver Int. 2013;33:1420–7. - PubMed
    1. Hamed MA, Ali SA. Non‐viral factors contributing to hepatocellular carcinoma. World J Hepatol. 2013;5:311–22. - PMC - PubMed

Publication types