. 2022 Jul;49(8):2994-3004.
doi: 10.1007/s00259-022-05832-7. Epub 2022 May 14.

Identifying the individual metabolic abnormities from a systemic perspective using whole-body PET imaging

Affiliations

Identifying the individual metabolic abnormities from a systemic perspective using whole-body PET imaging

Tao Sun et al. Eur J Nucl Med Mol Imaging. 2022 Jul.

Abstract

Introduction: Distinct physiological states arise from complex interactions among the various organs present in the human body. PET is a non-invasive modality with numerous successful applications in oncology, neurology, and cardiology. However, while PET imaging has been applied extensively in detecting focal lesions or diseases, its potential in detecting systemic abnormalities is seldom explored, mostly because total-body imaging was not possible until recently.

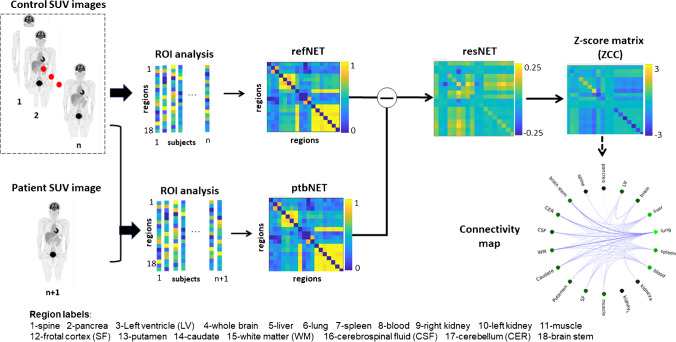
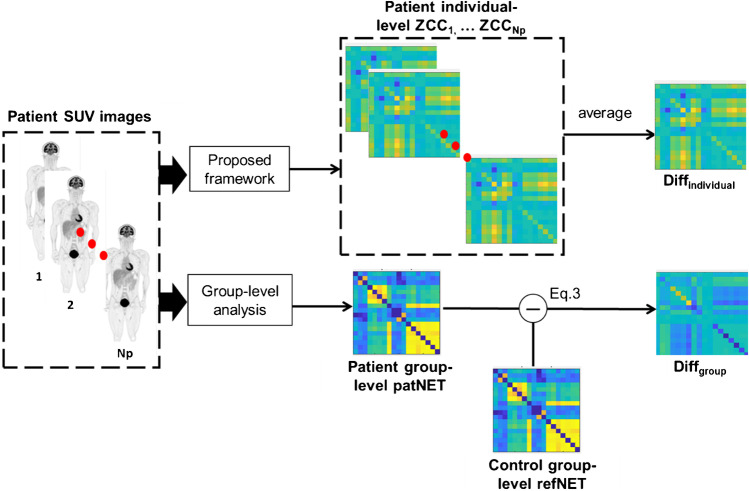
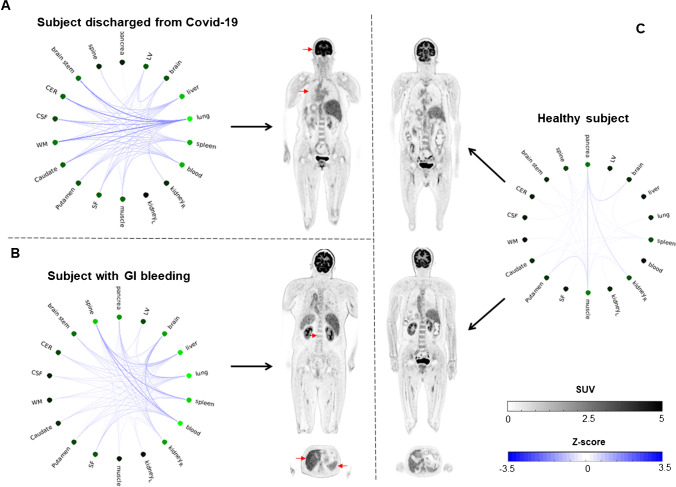
Methods: In this context, the present study proposes a framework capable of constructing an individual metabolic abnormality network using a subject's whole-body 18F-FDG SUV image and a normal control database. The developed framework was evaluated in the patients with lung cancer, the one discharged after suffering from Covid-19 disease, and the one that had gastrointestinal bleeding with the underlying cause unknown.

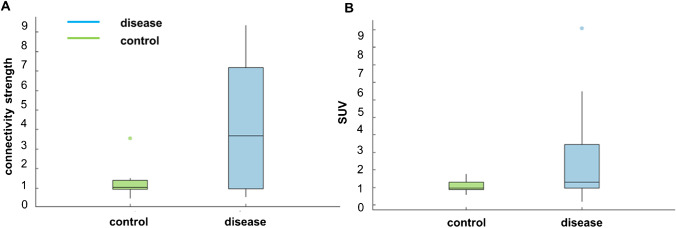
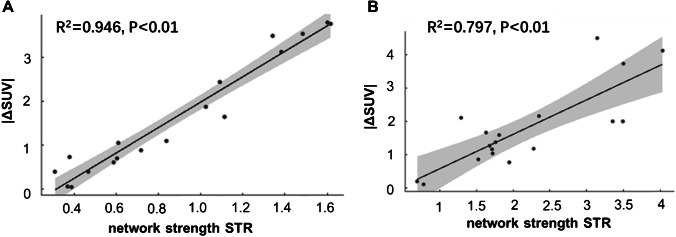
Results: The framework could successfully capture the deviation of these patients from healthy subjects at the level of both system and organ. The strength of the altered network edges revealed the abnormal metabolic connection between organs. The overall deviation of the network nodes was observed to be highly correlated to the organ SUV measures. Therefore, the molecular connectivity of glucose metabolism was characterized at a single subject level.

Conclusion: The proposed framework represents a significant step toward the use of PET imaging for identifying metabolic dysfunction from a systemic perspective. A better understanding of the underlying biological mechanisms and the physiological interpretation of the interregional connections identified in the present study warrant further research.

Keywords: Metabolic abnormality; Network analysis; Systemic disease; Whole-body PET.


Conflict of interest statement

The authors declare no competing interests.

Figures

Fig. 1
Fig. 1
The delineation of the 18 sampled regions comprising 11 organs and 7 sub-regions of the brain. The left kidney and the right kidney were treated as two separate ROIs. The one for the lung was on the left or right where the lesion resides and excluding the lesion
Fig. 2
Fig. 2
The proposed framework for obtaining the individual metabolic network from a patient scan. Reference network refNET is first constructed across all N controls, with each edge being the Pearson correlation coefficient between uptake values for each regional pair. Then, a new perturbed network ptbNET is constructed similarly by adding the patient to controls. The Z-score of the difference between the ptbNET and refNET can therefore be calculated as described by Eq. 1. The connectivity map can be plotted from the Z-score map for visualization
Fig. 3
Fig. 3
Illustration of the implementation of the group-level and individual-level analyses, and their comparison for the patient group with lung cancer
Fig. 4
Fig. 4
The connectivity plots for (A) and (B) patients with lung cancer and (C) a healthy control subject. The darker line indicates stronger edge connections between the nodes. The intensity of the green color indicates the strength at a particular node (dark green is stronger). Both connection degree and node strength exhibited differences between the patient and the control
Fig. 5
Fig. 5
Summary boxplots of (A) the individual connectivity strength at lung for the control and disease groups and (B) the corresponding SUVs at lung (50–60 min). The connectivity strength of the individual network appears to be more capable of separating the control group from the disease group
Fig. 6
Fig. 6
Metabolic connectivity plots for two abnormal subjects and a control. The images in the middle are the coronal SUV slices, and the plots on the two sides of these images are the network connections between the organs. In comparison to the control network, the networks of the abnormal subjects demonstrated denser connectivity and higher strength at the relevant nodes (corresponding to the abnormal uptake in the SUV image labelled with red arrows)
Fig. 7
Fig. 7
Correlation plots between the |ΔSUV| and the network strength presented in Fig. 6A,B at all sampled regions

Similar articles

Cited by

References

    1. Lo CC, Chiang AS. Toward whole-body connectomics. J Neurosci. 2016;36(45):11375–11383. doi: 10.1523/JNEUROSCI.2930-16.2016. - DOI - PMC - PubMed
    1. Thiele I, Sahoo S, Heinken A, Hertel J, Heirendt L, Aurich MK, et al. Personalized whole-body models integrate metabolism, physiology, and the gut microbiome. Mol Syst Biol. 2020;16(5):1–24. doi: 10.15252/msb.20198982. - DOI - PMC - PubMed
    1. Barajas-Martínez A, Easton JF, Rivera AL, Martínez-Tapia R, de la Cruz L, Robles-Cabrera A, et al. Metabolic physiological networks: the impact of age. Front Physiol. 2020;11(October):1–17. - PMC - PubMed
    1. Cui X, Geffers L, Yan GEJ. A computational approach to estimate interorgan metabolic transport in a mammal. PLoS One. 2014;9(6):e100963. doi: 10.1371/journal.pone.0100963. - DOI - PMC - PubMed
    1. Bashan A, Bartsch RP, Kantelhardt JW, Havlin S, Ivanov PC. Network physiology reveals relations between network topology and physiological function. Nat Commun. 2012;3(702):1. - PMC - PubMed

Substances