. 2022 Jun 2;109(6):1038-1054.
doi: 10.1016/j.ajhg.2022.04.009. Epub 2022 May 13.

Whole-exome sequencing identifies rare genetic variants associated with human plasma metabolites

Affiliations

Whole-exome sequencing identifies rare genetic variants associated with human plasma metabolites

Lorenzo Bomba et al. Am J Hum Genet. .

Abstract

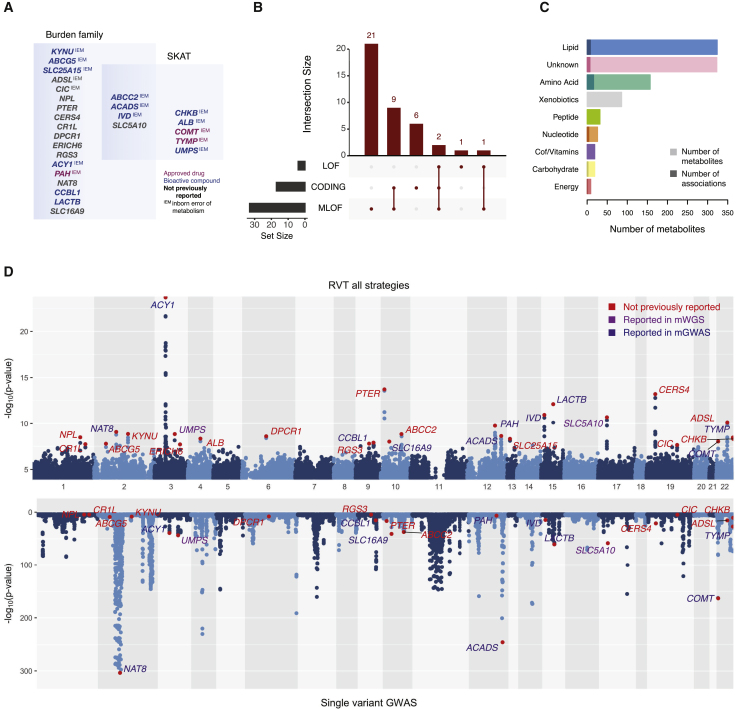
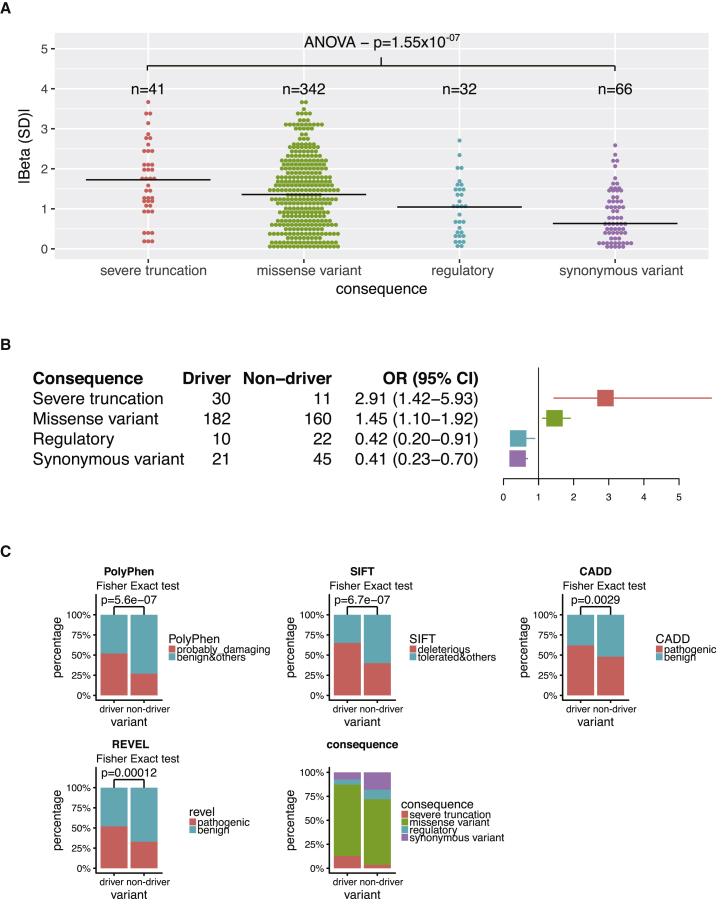
Metabolite levels measured in the human population are endophenotypes for biological processes. We combined sequencing data for 3,924 (whole-exome sequencing, WES, discovery) and 2,805 (whole-genome sequencing, WGS, replication) donors from a prospective cohort of blood donors in England. We used multiple approaches to select and aggregate rare genetic variants (minor allele frequency [MAF] < 0.1%) in protein-coding regions and tested their associations with 995 metabolites measured in plasma by using ultra-high-performance liquid chromatography-tandem mass spectrometry. We identified 40 novel associations implicating rare coding variants (27 genes and 38 metabolites), of which 28 (15 genes and 28 metabolites) were replicated. We developed algorithms to prioritize putative driver variants at each locus and used mediation and Mendelian randomization analyses to test directionality at associations of metabolite and protein levels at the ACY1 locus. Overall, 66% of reported associations implicate gene targets of approved drugs or bioactive drug-like compounds, contributing to drug targets' validating efforts.

Keywords: WES; WGS; drug targets; endophenotypes; loss-of-function; metabolomics; metabolon; proteomics; rare genetic variant; sequencing.


Conflict of interest statement

Declaration of interests John Danesh reports grants, personal fees, and non-financial support from Merck Sharp & Dohme (MSD); grants, personal fees, and non-financial support from Novartis; grants from Pfizer; and grants from AstraZeneca outside the submitted work. John Danesh sits on the International Cardiovascular and Metabolic Advisory Board for Novartis (since 2010); the Steering Committee of UK Biobank (since 2011); the MRC International Advisory Group (ING) member, London (since 2013); the MRC High Throughput Science ‘Omics Panel Member, London (since 2013); the Scientific Advisory Committee for Sanofi (since 2013); the International Cardiovascular and Metabolism Research and Development Portfolio Committee for Novartis; and the AstraZeneca Genomics Advisory Board (2018). Adam Butterworth reports institutional grants from AstraZeneca, Bayer, Biogen, BioMarin, Bioverativ, Merk and Sanofi. During the course of the project Praveen Surendran became an employee of GSK, Lorenzo Bomba became an employee of BioMarin, Mohd Karim became an employee of Variant Bio and Qi Guo became an employee of BenevolentAI.

Figures

None
Graphical abstract
Figure 1
Figure 1
Study design, including data, methods, and results summary Data —INTERVAL study description and correlation of metabolite levels ordered by super-pathways; rare variant test strategies —analysis windows (in green) were defined to be exons containing at most 20 rare variants (MAF ≤ 0.1%), three variant selection strategies were applied (CODING, MLOF, and LOF; variant classes are color coded), and for each strategy, four rare variant aggregation tests were used to explore different allelic architectures; results —results of WES RVT analysis at 5% FDR threshold and replication of discovery signals using WGS RVT analysis. Cof/Vitamins represent the super pathway cofactors and vitamins.
Figure 2
Figure 2
WES association results (A) List of genes discovered by type of test (burden family and/or SKAT). (B) UpSet plot of associations by approach. On the left, bar plot of total number of associations by approach and on top, bar plot of number of shared associations in multiple approaches. The number of associations in each set appears above the column, while approaches shared are indicated in the graphic below the column. (C) Bar plot of all metabolites used in the analysis split by pathway and number of associated metabolites shown in darker color. (D) Mirrored Manhattan plot showing −log10 Ps for WES single-variant tests (bottom) and WES rare-variant tests (top). Strongest gene-metabolite associations are highlighted in red. All genetic associations derived from any approach or aggregation test are reported in the RVT Manhattan plot. All 27 genes found to be associated with metabolites in RVT are labeled in the plot. Gene label color code highlights genes as not previously reported (red), reported in mWGS (purple), or reported in mGWAS (blue).
Figure 3
Figure 3
Driver variants analyses (A) Absolute effect size (beta in SD) of driver variants split by their predicted consequence on protein. (B) Enrichment of driver variants split by their predicted consequence on protein. (C) Enrichment of driver variants by different functional prediction methods: Polyphen, SIFT, CADD, REVEL, and predicted consequences.
Figure 4
Figure 4
ACY1/N-acetylmethionine in depth analysis (A) Proportions of haplotypes composed of non-driver, driver, and sentinel variants that are represented by their point shape in (B). (B) Scatter plot of effect sizes and relative standard errors of shared protein versus metabolite associations; color coding indicates predicted consequence on protein and point shape indicates type of variants. (C) Dot plots of phenotype residuals in carriers of driver and non-driver variants for both metabolite and protein levels.

References

    1. Kastenmüller G., Raffler J., Gieger C., Suhre K. Genetics of human metabolism: an update. Hum. Mol. Genet. 2015;24:R93–R101. - PMC - PubMed
    1. Shin S.-Y., Fauman E.B., Petersen A.-K., Krumsiek J., Santos R., Huang J., Arnold M., Erte I., Forgetta V., Yang T.-P., et al. An atlas of genetic influences on human blood metabolites. Nat. Genet. 2014;46:543–550. - PMC - PubMed
    1. Suhre K., Shin S.-Y., Petersen A.-K., Mohney R.P., Meredith D., Wägele B., Altmaier E., CARDIoGRAM, Deloukas P., Deloukas J., Erdmann J., et al. Human metabolic individuality in biomedical and pharmaceutical research. Nature. 2011;477:54–60. - PMC - PubMed
    1. Yousri N.A., Fakhro K.A., Robay A., Rodriguez-Flores J.L., Mohney R.P., Zeriri H., Odeh T., Kader S.A., Aldous E.K., Thareja G., et al. Whole-exome sequencing identifies common and rare variant metabolic QTLs in a Middle Eastern population. Nat. Commun. 2018;9:333. - PMC - PubMed
    1. Long T., Hicks M., Yu H.-C., Biggs W.H., Kirkness E.F., Menni C., Zierer J., Small K.S., Mangino M., Messier H., et al. Whole-genome sequencing identifies common-to-rare variants associated with human blood metabolites. Nat. Genet. 2017;49:568–578. - PubMed

LinkOut - more resources