. 2022 Jun 9;185(12):2103-2115.e19.
doi: 10.1016/j.cell.2022.04.035. Epub 2022 May 2.

Virological characteristics of the SARS-CoV-2 Omicron BA.2 spike

Affiliations

Virological characteristics of the SARS-CoV-2 Omicron BA.2 spike

Daichi Yamasoba et al. Cell. .

Abstract

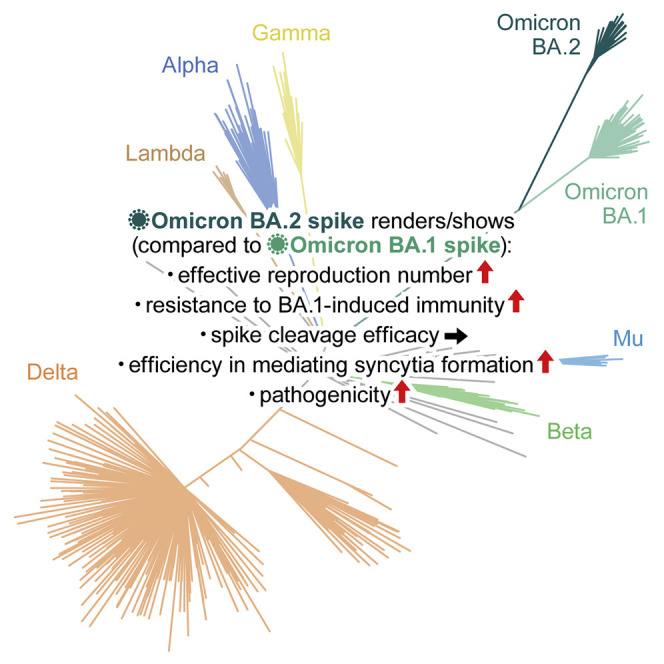
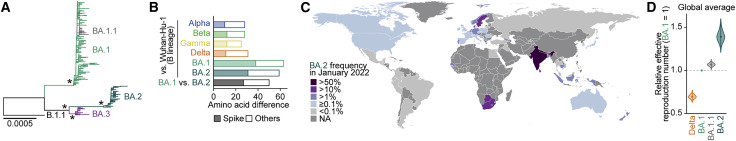
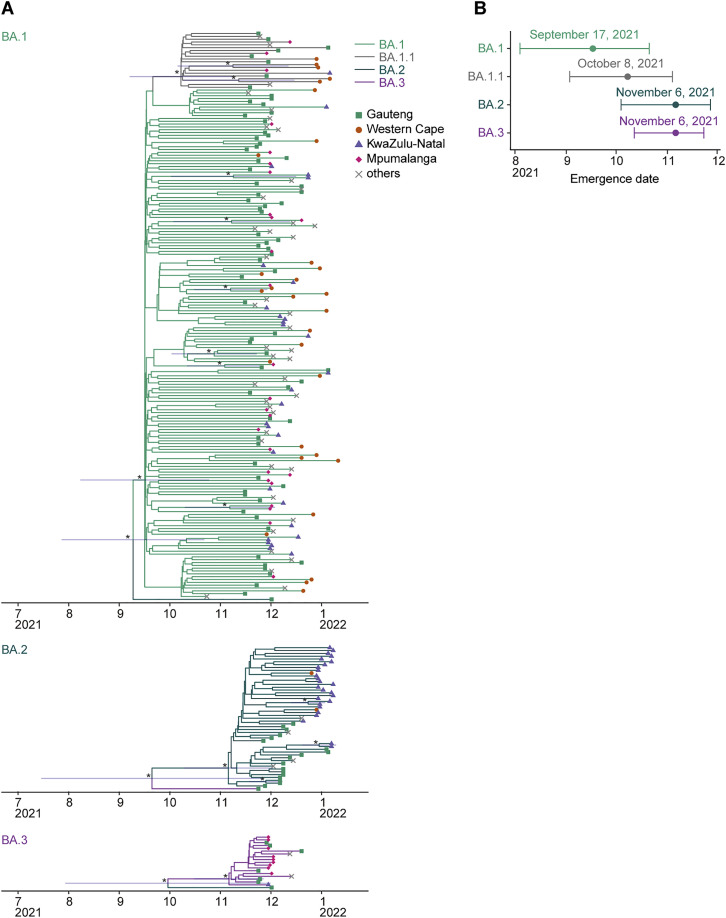
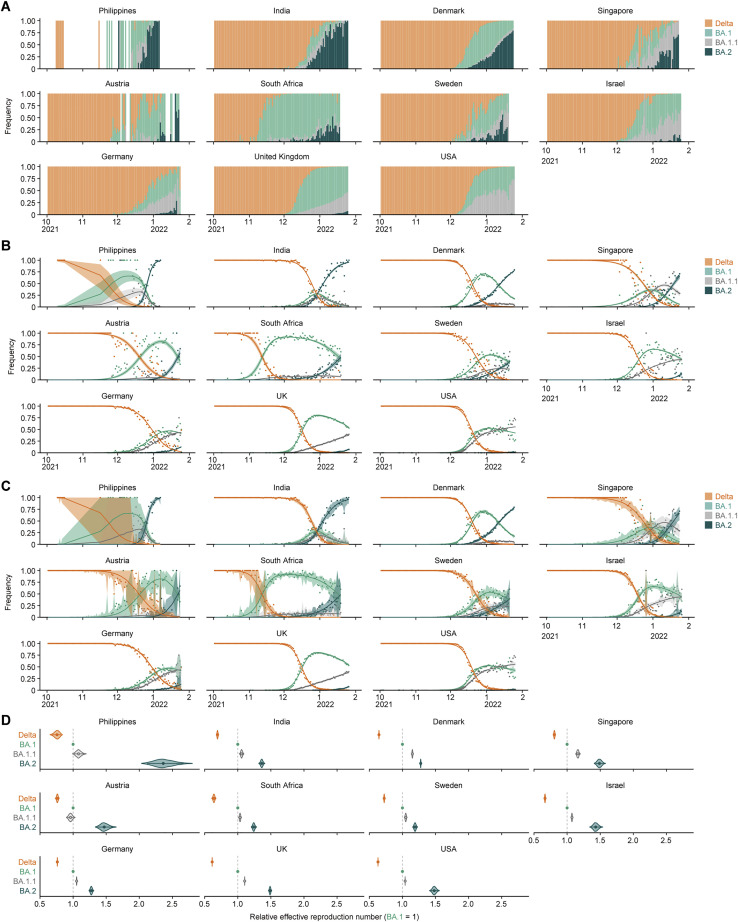
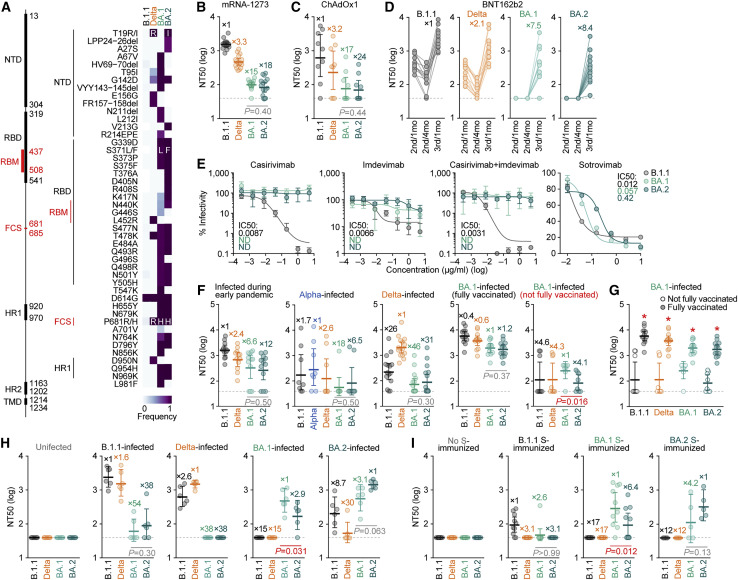
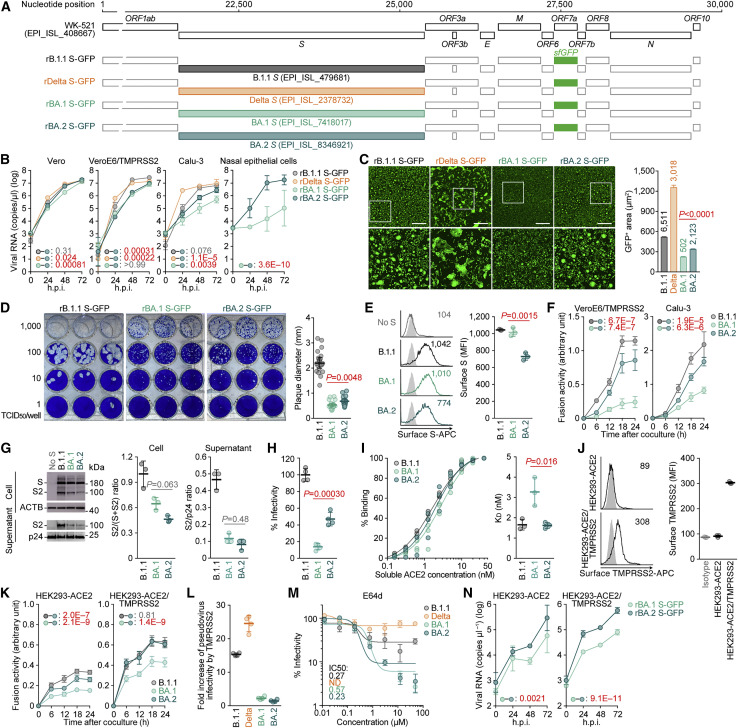
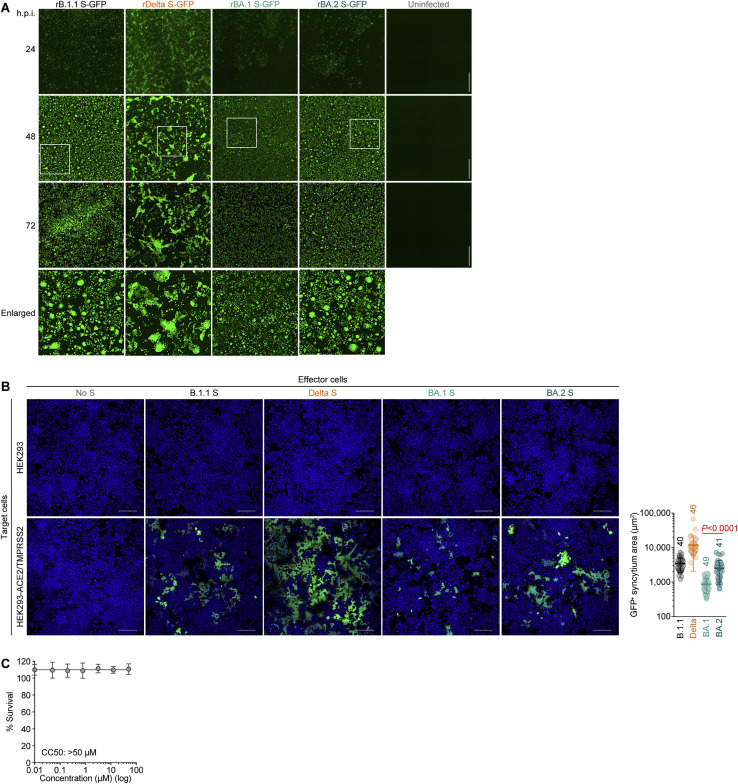
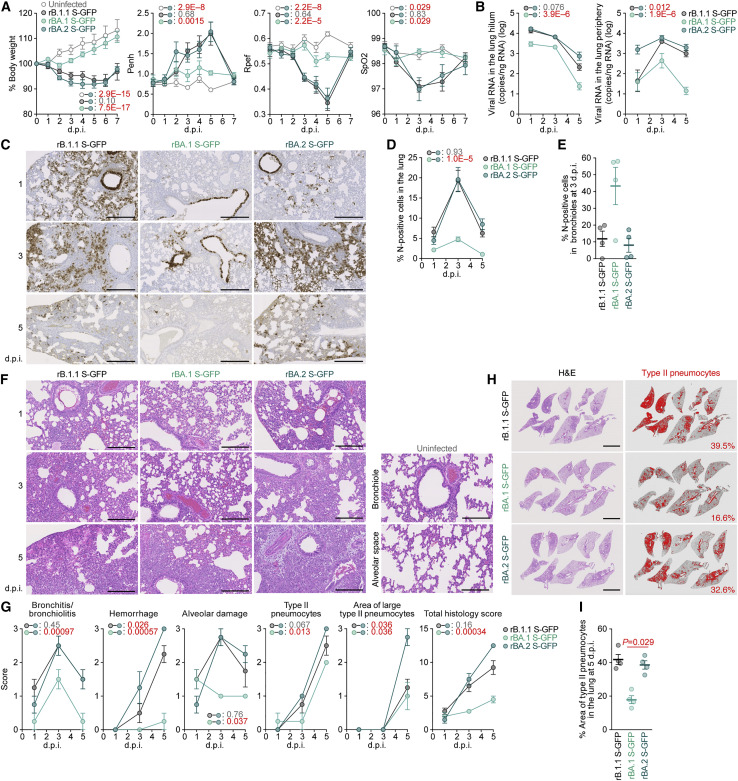
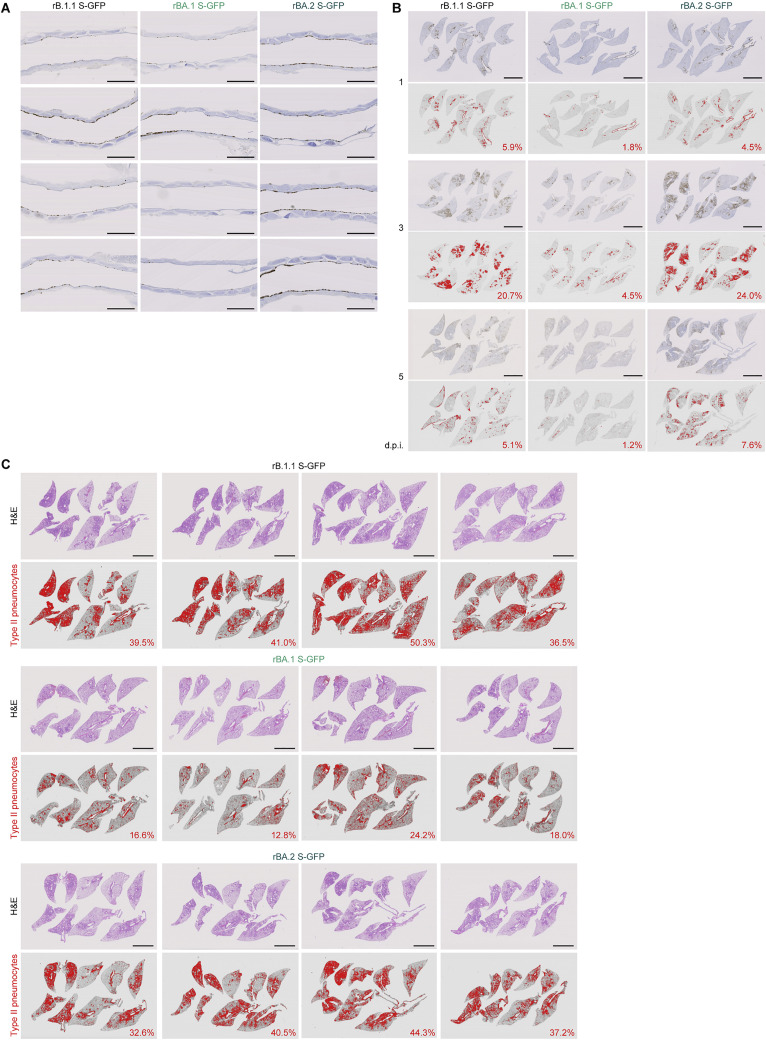
Soon after the emergence and global spread of the SARS-CoV-2 Omicron lineage BA.1, another Omicron lineage, BA.2, began outcompeting BA.1. The results of statistical analysis showed that the effective reproduction number of BA.2 is 1.4-fold higher than that of BA.1. Neutralization experiments revealed that immunity induced by COVID vaccines widely administered to human populations is not effective against BA.2, similar to BA.1, and that the antigenicity of BA.2 is notably different from that of BA.1. Cell culture experiments showed that the BA.2 spike confers higher replication efficacy in human nasal epithelial cells and is more efficient in mediating syncytia formation than the BA.1 spike. Furthermore, infection experiments using hamsters indicated that the BA.2 spike-bearing virus is more pathogenic than the BA.1 spike-bearing virus. Altogether, the results of our multiscale investigations suggest that the risk of BA.2 to global health is potentially higher than that of BA.1.

Keywords: B.1.1.529; BA.1; BA.2; COVID-19; Omicron; SARS-CoV-2; fusogenicity; pathogenicity; transmissibility.


Conflict of interest statement

Declaration of interests The authors declare no competing interests.

Figures

None
Graphical abstract
Figure 1
Figure 1
BA.2 epidemic (A) Maximum likelihood tree of the Omicron lineages sampled from South Africa. The asterisks indicate the nodes with ≥0.95 bootstrap values. (B) Number of amino acid differences detected between the different viral lineages in the S region (filled) and other regions (opened). (C) Relative frequency of BA.2 according to genome surveillance data in January 2022. The values of countries with ≥20 available SARS-CoV-2 sequences are shown. (D) Estimated relative effective reproduction number of each viral lineage, assuming a fixed generation time of 2.1 days. The global average value estimated by a Bayesian hierarchical model is shown. The value of each country is shown in Figure S2D. The posterior distribution (violin), 95% CI (line), and posterior mean (dot) are shown. See also Figures S1 and S2; Table S1.
Figure S1
Figure S1
Estimated emergence dates of the Omicron lineages, related to Figure 1 (A) Phylodynamics of BA.1 (top), BA.2 (middle), and BA.3 (bottom) sampled up to January 26, 2022, in South Africa. All BA.2 and BA.3 sequences and 200 randomly sampled BA.1 (including 20 BA.1.1) sequences were used. The time-resolved trees were constructed by using BEAST2. The 95% CI of the divergence time is shown for a node with a ≥0.95 posterior value (indicated by an asterisk). (B) Estimated emergence dates of the Omicron lineages. The 95% CI (error bar) and posterior mean (dot) are shown.
Figure S2
Figure S2
Epidemic dynamics of SARS-CoV-2 lineages in countries with a BA.2 epidemic, related to Figure 1 (A) Daily sequence frequency of each viral lineage in eleven countries where ≥100 BA.2 sequences had been reported up to January 25, 2022. These data were used as an input in a Bayesian hierarchical model to estimate epidemic dynamics. (B and C) Epidemic dynamics of SARS-CoV-2 viral lineages. The observed daily frequency (dot) and the dynamics estimated by the Bayesian model (posterior mean; line) are shown. Additionally, the 95% CI (B) and 90% prediction interval (C) are shown. (D) Estimated relative effective reproduction number of each viral lineage in each country. The posterior distribution (violin), 95% CI (line), and posterior mean (dot) are shown.
Figure 2
Figure 2
Immune resistance of BA.2 (A) Amino acid substitutions in S. Left, primary structure and domains of the virus. The numbers indicate the amino acid positions. NTD, N-terminal domain; RBM, receptor-binding motif; HR, heptad repeat; TMD, transmembrane domain. Right, heatmap showing the frequency of amino acid substitutions. Substitutions detected in >10% of sequences of any lineage are shown. (B–I) Neutralization assays. Neutralization assays were performed with pseudoviruses harboring the S proteins of B.1.1 (the D614G-bearing ancestral virus), Delta, BA.1 and BA.2, and the following sera and monoclonal antibodies. (B) mRNA-1273 vaccine (16 donors). (C) ChAdOx1 vaccine (9 donors). (D) BNT162b2 vaccine (13 donors). 2nd/1mo, 1 month after the 2nd dose; 2nd/4mo, 4 months after the 2nd dose; 3rd/1mo, 1 month after the 3rd dose. (E) Therapeutic monoclonal antibodies (casirivimab, imdevimab, casirivimab + imdevimab, and sotrovimab). IC50, 50% inhibitory concentration; ND, not determined. (F and G) Convalescent sera from individuals infected with an early pandemic virus (until May 2020) (12 donors), Alpha (8 donors), Delta (15 donors), or BA.1 [13 fully vaccinated donors or 8 not fully vaccinated donors]. (H) Sera from uninfected, B.1.1-infected, Delta-infected, BA.1-infected, and BA.2-infected hamsters at 16 d.p.i. (6 hamsters per each group). (I) Sera from mice immunized with empty vector-transfected cells (10 mice), cells expressing B.1.1 S (10 mice) or BA.1 S (H, right; 10 mice) were used. In (B)–(D) and (F)–(I), assays with each serum sample were performed in triplicate to determine the 50% neutralization titer (NT50). Each dot represents one NT50 value, and the geometric mean and 95% CI are shown. The numbers indicate the fold changes of resistance versus each antigenic variant. The horizontal dashed line indicates the detection limit (40-fold). Statistically significant differences between BA.1 and BA.2 were determined by two-sided Wilcoxon signed-rank tests (B, C, F, H, and I) or two-sided Mann-Whitney U tests (G, p < 0.05). Information on the vaccinated/convalescent donors is summarized in Table S2. In (E), the assays for each concentration were performed in triplicate, and the presented data are expressed as the average ± SD. See also Table S2.
Figure 3
Figure 3
Virological features of BA.2 in vitro (A) Scheme for the chimeric recombinant SARS-CoV-2 used in this study. The SARS-CoV-2 genome and its genes are shown. The template was SARS-CoV-2 strain WK-521 (PANGO lineage A, GISAID ID: EPI_ISL_408667), and the S genes were swapped with those of the respective lineages/strains (GISAID IDs are indicated in the figure). ORF7a was swapped with the sfGFP gene. (B) Growth kinetics of chimeric recombinant SARS-CoV-2 in Vero cells, VeroE6/TMPRSS2 cells, Calu-3 cells, and human nasal epithelial cells. (C) Fluorescence microscopy. The GFP area was measured in infected VeroE6/TMPRSS2 cells (multiplicity of infection [m.o.i.] 0.01) at 48 h.p.i. Left, representative panels. Higher-magnification views of the regions indicated by squares are shown at the bottom. Representative time-course data are shown in Figure S2E. Scale bars, 500 μm. Right, the summarized results. The numbers in the panel indicate the numbers of GFP-positive cells counted. (D) Plaque assay. Representative panels (left) and a summary of the recorded plaque diameters (20 plaques per virus) (right) are shown. (E) S expression on the cell surface. Representative histograms stained with an anti-S1/S2 polyclonal antibody (left) and the summarized data (right) are shown. In the left panel, the number in the histogram indicates mean fluorescence intensity (MFI). Gray histograms indicate isotype controls. (F) S-based fusion assay. The recorded fusion activity (arbitrary units) is shown. (G) Western blotting. Left, representative blots of S-expressing cells (top) and pseudovirus (bottom). ACTB is an internal control for the cells, whereas HIV-1 p24 is an internal control for the pseudovirus. kDa, kilodalton. Middle, the ratio of S2 to the full-length S plus S2 proteins in the cells. Right, the ratio of S2 to HIV-1 p24 in the pseudovirus (supernatant). (H) Pseudovirus assay. The percent infectivity compared with that of the virus pseudotyped with B.1.1 S are shown. (I) Binding affinity of SARS-CoV-2 S RBD to ACE2 by yeast surface display. The percentage of SARS-CoV-2 S RBD expressed on yeast binding to soluble ACE2 (left) and the summarized KD values (right) are shown. (J) TMPRSS2 expression on the cell surface. Representative histograms stained with an anti-TMPRSS2 polyclonal antibody (left) and the summarized data (right) are shown. In the left panel, the number in the histogram indicates MFI. Gray histograms indicate the isotype controls. (K) S-based fusion assay. The recorded fusion activity (arbitrary units) is shown. (L) Fold increase in pseudovirus infectivity based on TMPRSS2 expression. (M) E64d treatment. IC50, 50% inhibitory concentration; ND, not determined. (N) Growth kinetics of chimeric recombinant SARS-CoV-2 in HK293-ACE2 and HEK293-ACE2/TMPRSS2 cells. Assays were performed in quadruplicate (B, H, L, J, and N), octuplicate (B, most right) or triplicate (E–G, I, J, K, and M), and the presented data are expressed as the average ± SD. Each dot indicates the result of an individual plaque (D) and an individual replicate (E, G– J, L and I). Statistically significant differences between BA.2 and other variants across time points were determined by multiple regression (B, F, K, and N). Family-wise error rates (FWERs) calculated using the Holm method are indicated in the figures. Statistically significant differences between BA.1 and BA.2 were determined by two-sided Mann-Whitney U tests (C and D), two-sided Student’s t tests (E, H, and I), or two-sided paired t test (G). See also Figure S3.
Figure S3
Figure S3
Virological features of BA.2 in vitro, related to Figure 3 (A) Fluorescence microscopy. The GFP area were measured in infected VeroE6/TMPRSS2 cells (m.o.i. 0.01) at 24, 48, and 72 h.p.i. Higher-magnification views of the regions indicated by squares are shown at the bottom. The panels at 48 h.p.i. are identical to those shown in Figure 3C. (B) Coculture of S-expressing cells with HEK293-ACE2/TMPRSS2 cells. Left, representative images of S-expressing cells cocultured with HEK293 cells (top) or HEK293-ACE2/TMPRSS2 cells (bottom). Nuclei were stained with Hoechst 33342 (blue). Right, size distribution of syncytia (green). The numbers in the panel indicate the numbers of GFP-positive syncytia counted. (C) Cytotoxicity of E64d in HOS-ACE2-TMPRSS2 cells. The cells were cultured in the presence of serially diluted E64d for 48 h, and the cytotoxicity was measured using a cell counting kit-8 solution. The assay for each concentration was performed in sextuplicate, and the data are expressed as the average ± SD. CC50, 50% cytotoxic concentration. Scale bars, 500 μm (A) or 200 μm (B).
Figure 4
Figure 4
Virological features of BA.2 in vivo Syrian hamsters were intranasally inoculated with rB.1.1 S-GFP, rBA.1 S-GFP, and rBA.2 S-GFP. (A) Body weight, Penh, Rpef, and SpO2 values were routinely measured. Hamsters of the same age were intranasally inoculated with PBS (uninfected). (B) Viral RNA loads in the lung hilum (left) and periphery (right). (C) IHC of the viral N protein in the lungs at 1, 3, and 5 d.p.i of all infected hamsters (n = 4 per viral strain). Scale bars, 500 μm. (D and E) Percentage of N-positive cells in whole lung lobes (D) and bronchioles in the frontal/upper lung lobe at 3 d.p.i. (E) measured by IHC. In (D), the raw data are shown in Figure S4B. (F) H&E staining of the lungs of infected hamsters. Uninfected lung alveolar space and bronchioles are also shown. (G) Histopathological scoring of lung lesions. Representative pathological features are reported in our previous studies (Saito et al., 2022; Suzuki et al., 2022). (H and I) Type II pneumocytes in the lungs of infected hamsters. (H) Lung lobes of infected hamsters at 5 d.p.i. In each panel, H&E staining (left) and the digitalized inflammation area (right, indicated in red) are shown. The number in the right panel indicates the percentage of the section represented by the indicated area (i.e., the area indicated in red within the total area of the lung lobe). (I) The summarized data. Data are presented as the average (A, 6 hamsters per group; B–I, 4 hamsters per group) ± SEM. In (E) and (I), each dot indicates the result of an individual hamster. In (A), (B), (D), and (G), statistically significant differences between BA.2 and other variants or uninfected hamsters across time points were determined by multiple regression. The 0 d.p.i. data were excluded from the analyses. The FWERs calculated using the Holm method are indicated in the figures. In (I), the statistically significant differences between rBA.1 S-GFP and rBA.2 S-GFP were determined by a two-sided Mann-Whitney U test. In (C), (F), and (H), each panel shows a representative result from an individual infected hamster. Scale bars, 500 μm (C); 250 μm (F); or 5 mm (H). See also Figure S4.
Figure S4
Figure S4
Virological features of BA.2 in vivo, related to Figure 4 (A) IHC of the viral N protein in the middle portion of the tracheas of all infected hamsters (n = 4 per viral strain) at 1 d.p.i. Each panel shows a representative result from an individual infected hamster. (B) Right lung lobes of hamsters infected with B.1.1, BA.1 or BA.2 (n = 4 for each virus) at 1, 3 and 5 d.p.i. were immunohistochemically stained with an anti-SARS-CoV-2 N monoclonal antibody. In each panel, IHC staining (top) and the digitalized N-positive area (bottom, indicated in red) are shown. The number in the bottom panel indicates the percentage of the N-positive area. Summarized data are shown in Figure 4D. (C) Type II pneumocytes in the lungs of infected hamsters. Right lung lobes of hamsters infected with B.1.1 (n = 4), BA.1 (n = 4), and BA.2 (n = 4) at 5 d.p.i. In each panel, H&E staining (top) and the digitalized inflammation area (bottom, indicated in red) are shown. The number in the bottom panel indicates the percentage of the section represented by the indicated area (i.e., the area indicated in red within the total area of the lung lobe). The panels shown in the left column are identical to those shown in Figure 4H. Scale bars, 1 mm (A); or 5 mm (B); or 5 mm (C).

Similar articles

  • Virological characteristics of the SARS-CoV-2 Omicron BA.2 subvariants, including BA.4 and BA.5.
    Kimura I, Yamasoba D, Tamura T, Nao N, Suzuki T, Oda Y, Mitoma S, Ito J, Nasser H, Zahradnik J, Uriu K, Fujita S, Kosugi Y, Wang L, Tsuda M, Kishimoto M, Ito H, Suzuki R, Shimizu R, Begum MM, Yoshimatsu K, Kimura KT, Sasaki J, Sasaki-Tabata K, Yamamoto Y, Nagamoto T, Kanamune J, Kobiyama K, Asakura H, Nagashima M, Sadamasu K, Yoshimura K, Shirakawa K, Takaori-Kondo A, Kuramochi J, Schreiber G, Ishii KJ; Genotype to Phenotype Japan (G2P-Japan) Consortium; Hashiguchi T, Ikeda T, Saito A, Fukuhara T, Tanaka S, Matsuno K, Sato K. Kimura I, et al. Cell. 2022 Oct 13;185(21):3992-4007.e16. doi: 10.1016/j.cell.2022.09.018. Epub 2022 Sep 14. Cell. 2022. PMID: 36198317 Free PMC article.
  • Virological characteristics of SARS-CoV-2 Omicron BA.5.2.48.
    Wang W, Jin Q, Liu R, Zeng W, Zhu P, Li T, Wang T, Xiang H, Zhang H, Chen Q, Gao Y, Lai Y, Yan F, Xia X, Li J, Wang X, Gao Y. Wang W, et al. Front Immunol. 2024 Oct 1;15:1427284. doi: 10.3389/fimmu.2024.1427284. eCollection 2024. Front Immunol. 2024. PMID: 39411709 Free PMC article.
  • Attenuated fusogenicity and pathogenicity of SARS-CoV-2 Omicron variant.
    Suzuki R, Yamasoba D, Kimura I, Wang L, Kishimoto M, Ito J, Morioka Y, Nao N, Nasser H, Uriu K, Kosugi Y, Tsuda M, Orba Y, Sasaki M, Shimizu R, Kawabata R, Yoshimatsu K, Asakura H, Nagashima M, Sadamasu K, Yoshimura K; Genotype to Phenotype Japan (G2P-Japan) Consortium; Sawa H, Ikeda T, Irie T, Matsuno K, Tanaka S, Fukuhara T, Sato K. Suzuki R, et al. Nature. 2022 Mar;603(7902):700-705. doi: 10.1038/s41586-022-04462-1. Epub 2022 Feb 1. Nature. 2022. PMID: 35104835 Free PMC article.
  • The Rise and Fall of SARS-CoV-2 Variants and Ongoing Diversification of Omicron.
    Wiegand T, Nemudryi A, Nemudraia A, McVey A, Little A, Taylor DN, Walk ST, Wiedenheft B. Wiegand T, et al. Viruses. 2022 Sep 10;14(9):2009. doi: 10.3390/v14092009. Viruses. 2022. PMID: 36146815 Free PMC article. Review.
  • The emergence and implications of SARS-CoV-2 omicron subvariant BA.2.86 on global health.
    Satapathy P, Kumar P, Gupta JK, Rabaan AA, Al Kaabi NA, Mohanty D, Naveen P, Khatib MN, Gaidhane S, Zahiruddin QS, Neyazi A. Satapathy P, et al. Int J Surg. 2024 Apr 1;110(4):2498-2501. doi: 10.1097/JS9.0000000000001070. Int J Surg. 2024. PMID: 38215252 Free PMC article. Review.

Cited by

References

    1. Bouckaert R., Heled J., Kühnert D., Vaughan T., Wu C.H., Xie D., Suchard M.A., Rambaut A., Drummond A.J. BEAST 2: a software platform for Bayesian evolutionary analysis. PLoS Comput. Biol. 2014;10:e1003537. doi: 10.1371/journal.pcbi.1003537. - DOI - PMC - PubMed
    1. Cameroni E., Bowen J.E., Rosen L.E., Saliba C., Zepeda S.K., Culap K., Pinto D., VanBlargan L.A., De Marco A., di Iulio J., et al. Broadly neutralizing antibodies overcome SARS-CoV-2 Omicron antigenic shift. Nature. 2022;602:664–670. doi: 10.1038/s41586-021-04386-2. - DOI - PMC - PubMed
    1. Cao Y., Wang J., Jian F., Xiao T., Song W., Yisimayi A., Huang W., Li Q., Wang P., An R., et al. Omicron escapes the majority of existing SARS-CoV-2 neutralizing antibodies. Nature. 2021;602:657–663. doi: 10.1038/d41586-41021-03796-41586. - DOI - PMC - PubMed
    1. Capella-Gutiérrez S., Silla-Martínez J.M., Gabaldón T. trimAl: a tool for automated alignment trimming in large-scale phylogenetic analyses. Bioinformatics. 2009;25:1972–1973. doi: 10.1093/bioinformatics/btp348. - DOI - PMC - PubMed
    1. Cele S., Jackson L., Khoury D.S., Khan K., Moyo-Gwete T., Tegally H., San J.E., Cromer D., Scheepers C., Amoako D., et al. Omicron extensively but incompletely escapes Pfizer BNT162b2 neutralization. Nature. 2021;602:654–656. doi: 10.1038/d41586-41021-03824-41585. - DOI - PMC - PubMed

Publication types

Substances