. 2022 Jun 23;185(13):2354-2369.e17.
doi: 10.1016/j.cell.2022.04.028. Epub 2022 May 13.

A family of conserved bacterial virulence factors dampens interferon responses by blocking calcium signaling

Affiliations

A family of conserved bacterial virulence factors dampens interferon responses by blocking calcium signaling

Noémie Alphonse et al. Cell. .

Abstract

Interferons (IFNs) induce an antimicrobial state, protecting tissues from infection. Many viruses inhibit IFN signaling, but whether bacterial pathogens evade IFN responses remains unclear. Here, we demonstrate that the Shigella OspC family of type-III-secreted effectors blocks IFN signaling independently of its cell death inhibitory activity. Rather, IFN inhibition was mediated by the binding of OspC1 and OspC3 to the Ca2+ sensor calmodulin (CaM), blocking CaM kinase II and downstream JAK/STAT signaling. The growth of Shigella lacking OspC1 and OspC3 was attenuated in epithelial cells and in a murine model of infection. This phenotype was rescued in both models by the depletion of IFN receptors. OspC homologs conserved in additional pathogens not only bound CaM but also inhibited IFN, suggesting a widespread virulence strategy. These findings reveal a conserved but previously undescribed molecular mechanism of IFN inhibition and demonstrate the critical role of Ca2+ and IFN targeting in bacterial pathogenesis.

Keywords: Ca(2+); CaMKII; ISG; JAK/STAT; OspC1; OspC3; Shigella; T3SS; calcium; calmodulin; host-pathogen interactions; interferons.


Conflict of interest statement

Declaration of interests The authors declare no competing interests.

Figures

None
Graphical abstract
Figure S1
Figure S1
OspC effectors block ISG expression, related to Figure 1 (A) HeLa cells were infected with WT Shigella sonnei expressing the adhesin AfaI for 5 h at an MOI of 1. Viperin and IFIT1 mRNA expression was quantified by qRT-PCR. As a comparison, cells were treated with IFNβ (10 ng/mL) for 5 h. (B) RNA-seq analysis of HEK293T cells transfected with cells expressing OspC1, OspC3, and the empty GFP control (GFP), followed by 18 h treatment with IFNβ (10 ng/mL). Normalized enrichment scores (NES) and false discovery rate (FDR) q values (next to bars) for the 5 highest scoring gene sets from the comparison GFP versus OspC1 IFNβ-treated (left) and GFP versus OspC3 IFNβ-treated (right). (C) Gating strategy for Tetherin expression. Debris were eliminated using the forward (FSC) and side scatter (SSC). Within the cell population, single cells were discriminated from doublets. Live cells were discriminated using a live/dead dye (x axis) and transfected cells appeared GFP+ (y axis). Tetherin mean fluorescence intensity (MFI) was calculated within the live GFP+ population (green rectangle). Dead cells shown in red and live GFP− (untransfected cells) were not included in Tetherin MFI measurement. (D) Quantification of IFIT1 western blot shown Figure 1I. Data represent the mean ± SEM of 3 independent experiments. p < 0.05 (t test).
Figure 1
Figure 1
The OspC family of Shigella effectors inhibits IFN signaling and ISG expression (A) Experimental layouts for (B), (H), and (I). (B) Uninfected (UI) HeLa cells or cells infected with WT or ΔmxiD S. sonnei expressing the adhesin AfaI (multiplicity of infection [MOI] ∼1) were treated with IFNβ for 4.5 h. Viperin (left) and IFIT1 (right) mRNA expression was quantified by qRT-PCR. Data are normalized to untreated control samples. Statistical analysis was performed by two-way ANOVA. (C) Experimental layouts for (D)–(G). (D) HEK293T-ISRE reporter cells transfected with GFP-tagged Shigella effector plasmids were treated with IFNβ for 18 h after which luciferase production was monitored. Data are normalized to the empty GFP control vector. Statistical significance was determined by Student’s t test compared with the empty vector control. (E) HEK293T cells cotransfected with GFP-effector expression plasmids plus an ISRE luciferase reporter plasmid were treated for 18 h with a 5-fold dilution series of IFNα, IFNβ, and IFNλ1 (left to right). Alternatively, HeLa cells cotransfected with GFP-effector expression plasmids plus a GAS luciferase reporter plasmid were treated with IFNγ (right panel). Data are expressed as arbitrary luminescence units (AU). Statistical analysis was performed by two-way ANOVA with Dunnett’s post-test, comparing each condition with the empty GFP control. (F) HEK293T cells transfected with GFP-effector expression plasmids were treated with IFNβ (10 ng/mL) or IFNλ1 (20 ng/mL) for 18 h. Viperin gene expression was quantified by qRT-PCR, normalized to the empty vector control (GFP). Statistical analysis was performed by one-way ANOVA compared with the empty vector control. (G) HEK293T cells transfected with GFP-tagged effector expression plasmids were treated with IFNβ for 18 h. Tetherin mean fluorescence intensity (MFI) was measured by flow cytometry. Data were normalized to the empty vector control (GFP). Statistical significance was determined by one-way ANOVA. (H) Uninfected (UI) HeLa cells or cells infected with WT, ΔospC1, ΔospC3, or ΔospC1/C3 S. sonnei expressing the adhesin AfaI (MOI ∼ 1) were treated with IFNβ for 4.5 h. Viperin and Ifit1 mRNA expression normalized to WT-infected cells. Statistical analysis was performed using Student’s t test. (I) Similarly to (H), following Shigella infection, cells were treated with IFNβ for 4.5 h. IFIT1 protein expression was measured by western immunoblotting. Actin was used as a loading control. Data shown are representative of 4 experiments. qRT-PCR data were calculated using the ΔΔCt relative to the GAPDH gene. Data show means ± SEM of 3–6 independent experiments. ns, nonsignificant; p < 0.05; ∗∗ p < 0.01; ∗∗∗ p < 0.001; ∗∗∗∗ p < 0.0001. See also Figure S1.
Figure S2
Figure S2
OspC 1 and 3 inhibition of IFN signaling is independent of Caspase-mediated cell death, related to Figure 2 (A) LDH release in HEK293T cells transfected with GFP-tagged effector plasmids followed by 18 h treatment or not with IFNβ (10 ng/mL). Data are expressed as percentage of LDH release relative to a lysis control. Data represent the mean ± SEM of five independent experiments. (B) Similar to (A) except cell viability was measured from intracellular ATP concentrations using Cell Titer Glo. Data are expressed as a percentage of the values in GFP transfected, unstimulated (Ctrl) cells. Data represent the mean ± SD of 2 independent experiments. (C) Similar to (A) except cell viability was measured by flow cytometry with a live/dead stain (see Figure S1B for gating strategy). Data represent the mean ± SEM of three independent experiments. (A–C) Statistical analyses were carried out using two-way ANOVA with Tukey’s multiple comparisons test. (D) HEK293T cells co-transfected with GFP-tagged effector plasmids and an ISRE reporter were treated with cell death inhibitors Z-VAD-FMK (25 μM) or Necrosulfonamide (20 μM) before IFNβ (10 ng/mL) stimulation for 18 h. Data show means ± SEM of at least three independent experiments. (E and F) Statistical comparison of data presented in (B). Analyses of DMSO versus drug treated sample (E) or GFP versus other constructs (F) were conducted using one-way ANOVA with Dunnett’s multiple comparisons test. ns, nonsignificant; p < 0.05; ∗∗ p < 0.01; ∗∗∗ p < 0.001.
Figure S3
Figure S3
N-terminal fragments of OspC 1, and OspC3 inhibit ISG expression, related to Figure 2 (A) 3D structure of OspC3 derived from AlphaFold. The N-terminal domain is depicted in blue and the C-terminal domain in green. The predicted secretion sequence is depicted in red. (B) Diagrammatic representation of OspC truncation vectors. OspC1 truncations are shown is blue, OspC2 in royal blue and OspC3 in turquoise. C- and N-terminal amino acid positions are indicated for each construct. (C) Mouse Swiss3T3 cells were transfected with OspC1, OspC3 or their associated E326A and H328A (EH/AA) point mutants and treated with murine IFNβ (1,000 U/mL) overnight. STAT1, IFIT1, and IFITM3 protein expression was measured by western immunoblotting. Actin was used as a loading control. Data shown are representative of 2 independent experiments. (D) Densitometry quantification of experiment shown Figure 2E. Data represent the mean ± SEM of 3 independent experiments. Statistical analysis was performed with two-way ANOVA. (E) Uninfected (UI) HeLa cells or cells infected with S. sonnei (WT), ΔospC1/C3 Shigella, or ΔospC1/C3, pB Shigella expressing the adhesin AfaI at a MOI of 10. 30 min postinvasion, cells were treated with IFNβ (10 ng/mL) for 4.5 h. PI uptake was monitored at the indicated time points. Data are expressed as the percentage of PI uptake compared with wells treated with Triton-X100. Statistical analysis between PI uptake profiles was performed with a two-way ANOVA with Dunnett’s multiple comparisons. Data are representative of 2 independent experiments (Error bars represent SD). (F and G) Similarly to (E), cells were treated with IFNβ (10 ng/mL, F) or IFNγ (10 ng/mL, G) for 18 h prior to infection, and infected at an MOI of 50. (H) Quantification of IFIT1 immunoblot shown in Figure 2G. Data represent the mean ± SEM of 3 independent experiments. Statistical analysis between was performed with one-way ANOVA. p < 0.05; ∗∗ p < 0.01; ∗∗∗ p < 0.001; ∗∗∗∗ p < 0.001.
Figure 2
Figure 2
OspC effectors inhibit IFN signaling and cell death via distinct molecular mechanisms (A) Diagrammatic representation of chimeric GFP-tagged OspC2/3 effectors. OspC2 fragments are shown in royal blue, whereas OspC3 are shown in turquoise. (B) HEK293T cells were cotransfected with an ISRE luciferase reporter and GFP-tagged chimeric effector plasmids. Cells were treated for 18 h with IFNβ. Statistical analysis was carried out using one-way ANOVA. (C) HEK293T cells transfected with GFP-tagged full-length OspC plasmids or N- or C-terminal truncation mutants of OspC effectors (shown diagrammatically in supplementary Figure S3B) were treated for 18 h with IFNβ. Tetherin mean fluorescence intensity (MFI) was measured by flow cytometry. Statistical analysis was performed by one-way ANOVA with Dunnett’s post-test, comparing each condition with the empty GFP control. (D) Similarly to (B), except OspC1 and OspC3, E326A and H328A (EH/AA) point mutants were used in addition to wild-type plasmids. To control for cell viability, cells were cotransfected with a Renilla luciferase internal control vector. Statistical analysis significance was determined by one-way ANOVA. (E) Cell lysates from experiment carried out in (D) were subjected to SDS-PAGE. STAT1 and IFIT1 protein expression was measured by western immunoblotting. GFP was used as control of transfection efficiency. (F) Similarly to (C), except that GFP-tagged OspC3, OspC3 EH/AA, or OspD1 expression plasmids were used. Statistical significance was determined by one-way ANOVA. (G) Uninfected (UI) HeLa cells or cells infected with WT, ΔospC1/C3 or ΔospC1/C3 expressing an OspC2/OspC3 chimera (ΔospC1/C3, pB− B in Figure 2A) S. sonnei expressing the adhesin AfaI (MOI ∼ 10) were treated with IFNβ for 4.5 h. IFIT1 protein expression was visualized by immunoblotting. (B–D and F). Data show means ± SEM of 3 independent experiments. (E and G) For immunoblotting, actin was used as a loading control, and data shown are representative of at least 3 experiments. ns, nonsignificant; p < 0.05; ∗∗ p < 0.01; ∗∗∗ p < 0.001. See also Figures S2 and S3.
Figure 3
Figure 3
OspC1 and OspC3 bind and inhibit calmodulin (CaM) (A) Experimental layout for (B–D). (B) Lysates of HEK293T cells expressing GFP-tagged effectors were incubated with calmodulin (CaM) beads. Cell lysis and pulldown were carried out in the presence of buffer containing CaCl2 or EDTA to determine interaction with Ca2+-bound or Ca2+-free CaM, respectively. Bound proteins were eluted using the opposite condition. The presence of GFP-tagged proteins in the lysates or pulldown was analyzed by western immunoblotting. (C) Similar to (B), except N- or C-terminal truncation mutants of OspC effectors were studied (shown in Figure S3B). Pulldown was conducted in buffer containing EDTA, whereas elution was performed using CaCl2. (D) Similar to (C), except OspC1 and OspC3, E326A and H328A (EH/AA) point mutants were studied. (E) Experimental layout for (F). (F) HEK293T cells expressing GFP-tagged effectors were treated with 2 μM ionomycin for 30 s. CaMKII phosphorylation was analyzed by immunoblotting. (G) Similar to (B), lysates of cells expressing GFP-effectors were subjected to affinity purification with CaM beads in the presence of CaCl2. Interaction with pCaMKII was analyzed by immunoblotting. (H) HeLa cells were infected with the indicated S. sonnei strains expressing the adhesin AfaI (MOI ∼ 1) for 3 h. CaMKII phosphorylation was analyzed by immunoblotting. For immunoblotting, actin and/or total proteins were used as loading controls. Data shown are representative of 3–5 experiments. See also Figures S4 and S5.
Figure S4
Figure S4
OspC1, OspC2, and OspC3 interact with calmodulin, related to Figure 3 (A) Legend for interpretation of Figures S4B–S4D. (B–D) OspC1, 2, and 3 underwent a yeast 2-hybrid interaction assay. High-confidence interactor partners are shown for OpsC1 (B), OspC2 (C), and OspC3 (D).
Figure S5
Figure S5
OspC effectors block STAT1 phosphorylation, related to Figures 3 and 4 (A) Structural model of OspC1, predicted using AlphaFold with the N-terminal domain (40–337) in pink and the C-terminal domain (338–469) in gray. The location of the first helix (⍺1) is indicated. (B) AlphaFold-generated model of calmodulin (CaM) bound to OspC1. The two lobes of CaM (purple) are wrapped around the ⍺1 helix of OspC1. (C) Crystal structure of the CaM-CaMKII complex (PDB: 2WEL). As for OspC1, the two lobes of CaM (purple) wrap around a single N-terminal helix of CaMKII (teal). (D) Quantification of phosphorylated CaMKII immunoblot shown Figure 3H. (E) Quantification of IFIT1 and STAT1 immunoblots shown Figure 4D. (F) Experimental layout for Figure 4H. (G) Experimental layout for Figure 4I. (H) Quantification of phosphorylated STAT1 immunoblot shown in Figure 4I. Data represent the mean ± SEM of 5 (D), 3 (E and H) independent experiments. Statistical analyses were carried out using one- (D) or two-way ANOVA (E and H). p < 0.05; ∗∗ p < 0.01. (I) Diagram summarizing our findings: IFNs restrict Shigella infection via the JAK/STAT-mediated induction of ISGs. Ca2+/CaM/CaMKII modulate IFN signaling by potentiating STAT1 phosphorylation. Shigella OspC1 and OspC3 bind and inhibit CaM to block CaMKII phosphorylation, STAT1 activation and ISG expression.
Figure 4
Figure 4
CaM/CaMKII modulate JAK/STAT and IFN signaling (A) Experimental layouts for (B), (C), and (G). (B) HEK293T cells were cotransfected with ISRE firefly and Renilla reporters. Cells were treated with 2-fold dilutions of W7, KN93, or TyrA9 30 min prior to the addition of IFNβ for 18 h. Statistical analyses were performed by one-way ANOVA comparing drug exposed samples with their no drug controls. (C) Similar to (B), except HeLa cells expressing a GAS reporter were treated with W7 and IFNγ. (D) Tet-OFF parental HeLa cells (Ctrl) or cells depleted for CaM (CaM KO) were treated with 1 μg/mL doxycycline for 72 h, before treatment with IFNβ for 18 h. STAT1, IFIT1, and IFITM3 protein expressions were analyzed by immunoblotting. (E) Similar to (D), except STAT1 and IFIT1, mRNA expressions were quantified by qRT-PCR. Statistical significance was determined by two-way ANOVA. (F) Ctrl or CaM KO HeLa cells were treated with doxycycline as in (D). Uninfected (UI) cells or cells infected with WT, ΔospC1/C3 or ΔospC1/C3 expressing an OspC2/OspC3 chimera (ΔospC1/C3, pB−B in Figure 2A) S. sonnei expressing the adhesin AfaI (MOI ∼ 10) were treated with IFNβ for 4.5 h. IFIT1 protein expression was visualized by immunoblotting. (G) Similar to (B), except STAT1, phosphorylation was analyzed in HEK293T cells treated with IFNβ for 30 min. (H) HEK293T cells were transfected with the indicated effectors and treated with IFNβ for 30 min (experimental layout shown in Figure S5F). STAT1 phosphorylation was analyzed by western immunoblotting. (I) HeLa cells were infected with the indicated AfaI-expressing Shigella strains (MOI∼ 1) for 3 h, followed by 30 min treatment with IFNβ. STAT1 phosphorylation was analyzed by western immunoblotting (experimental layout shown in Figure S5G). (J) Experimental layout for (K). (K) HEK293T cells were cotransfected with an ISRE luminescence reporter, dsRed-tagged effector plasmids and either empty GFP, or GFP-tagged active CaMKII (T286D, T305/6A), followed by treatment with IFNβ for 18 h. Luminescence data were normalized to the empty dsRed, empty GFP control. Statistics represent Student’s t test comparing each dsRed effector with the empty control, in either GFP or CaMKII active expressing cells. Data show means ± SEM of 3–5 independent experiments. For immunoblotting, actin and/or total proteins were used as loading controls. Data shown are representative of 3–5 experiments. ns, nonsignificant; p < 0.05; ∗∗ p < 0.01; ∗∗∗ p < 0.001; ∗∗∗∗ p < 0.0001. See also Figure S5.
Figure 5
Figure 5
OspC effectors are phylogenetically and functionally conserved across multiple bacterial pathogens (A) Maximum likelihood phylogenetic tree showing the relatedness between Shigella OspC3 and its closest homologs in the NCBI database generated in iTol. (B) Amino acid identity matrix comparing distinct regions of the OspC protein with 8 homologs. WP, whole protein; SS, disordered region/predicted secretion sequence; Nt, N-terminal domain; Ct, C-terminal domain. (C) Representative sequence alignment of Shigella OspC3 and 4 representative homologs from amino acid 1 to 252. Predicted secondary structures are displayed below the alignment, and conservation scores are shown above the alignment. The predicted secretion sequence is indicated by a black bar, whereas the N-terminal domain is indicated in green. h, helix; e, extended strand of β sheet. (D) GFP-tagged representative OspC homologs were subjected to affinity purification with CaM beads. Cell lysis and pulldown were carried out in buffer containing EDTA, before elution in CaCl2 (experimental layout shown in Figure 3A). Data shown are representative of 4 experiments. E. albertii pulldown samples produced consistently higher chemiluminescent signal compared with other samples in the same experiment. The gel therefore represents E. albertii from a different experimental replicate, from the other displayed samples. (E) HEK293T cells cotransfected with GFP-effector expression plasmids plus an ISRE luciferase reporter plasmid were treated for 18 h with IFNβ before subjecting lysates to luciferase assay. Data are expressed as percentage of the empty GFP control vector. Data show means ± SEM of 4 independent experiments. Statistical analyses were performed by Student’s t test compared with the empty GFP control. p < 0.05; ∗∗ p < 0.01; ∗∗∗ p < 0.001. See also Figure S6.
Figure S6
Figure S6
Pairwise comparison of Shigella OspC1, OspC2, and OspC3 with their identified homologs, related to Figure 5 The genomes harboring OspC homologs (Figure 5A) were subject to BLAST analysis to identify components of the type III secretion system (T3SS) translocon using the Shigella MxiD amino acid sequence as query. T3SS containing genomes are displayed with a plus symbol. Amino acid sequences of the OspC homologs were subject to analysis with PREFFECTOR, which searches for putative secretion sequences. The PREFFECTOR score is given in the table, with 1 being the maximum value, and 0 being the minimum. The number of BLAST hits in the OspC query was compared per genome as a proxy for OspC copy number, which is also indicated in the table. The OspC homologs identified by BLASTp in Figure 5A were subject to multiple sequence alignment using ClustalW against Shigella OspC1, 2, and 3 sequences. The output pairwise identity matrix was visualized in Prism, and percentage sequence similarity is visualized by a sliding color scale shown in the figure.
Figure S7
Figure S7
Restriction of S. sonnei infection by IFN is partially independent of cell death, related to Figure 6 (A) Experimental layout for (B). (B) HeLa cells were pretreated for 18 h with 10 ng/mL of IFNβ and then infected with S. sonnei (WT) or ΔospC1/C3 Shigella at a MOI of 100. 30 min later, cells were washed and treated with gentamicin. Infected cells were lysed and Shigella colony forming units (CFU) were enumerated at 1, 3, and 5 h postinfection (h.p.i). Data represent the mean ± SEM of five independent experiments. Statistical analysis was performed by one-way ANOVA. (C) Experimental layout for (D). (D) Wild-type T84 cells (T84wt) were treated with cell death inhibitors Z-VAD-FMK (ZVad) at 25 μM and Necrosulfonamide (Necro) at 20 μM 30 min before infection with S. sonnei (WT or ΔospC1/C3) at a MOI of 30. 30 min later, cells were washed and treated with gentamicin and 10 ng/mL of IFNβ (left), IFNλ1 (middle), or IFNγ (right). Inhibitors were kept through the duration of the experiment. Shigella colony forming units (CFU) were enumerated at 1, 3, and 5 h postinfection. Data represent the mean ± SEM of 2–4 independent experiments. Statistical analyses were performed by two-way ANOVA. (E) HeLa cells were pretreated for 18 h with 10 ng/mL of IFNβ or IFNγ. Cells were then infected with AfaI-expressing S. sonnei (WT), ΔospC1/C3 or ΔospC1/3, pB (expressing an OspC3 variant that blocks IFN but does not induce cytotoxicity, MOI 50). Cells were lysed 5 h postinfection and CFUs were enumerated. Data represent the means ± SD of 2 independent experiments performed in triplicates. (F) Related to Figure 6E. 1 × 105 T84wt or cells that lack type I and type III IFN receptors (IFNR dKO, purple lines) were infected with WT (plain lines) or ΔospC1/C3 Shigella (dashed lines) at MOI 30. At the indicated time points, infected cells were lysed and Shigella CFUs were enumerated. Data represent the means ± SEM of at least 3 independent experiments. Statistical analyses were performed by two-way ANOVA. p < 0.05; ∗∗ p < 0.01.
Figure 6
Figure 6
Type I and III IFNs restrict infection of Shigella in epithelial cells (A) Experimental layouts for (B)–(G) and S8F. (B–D) Wild-type T84 cells (T84wt) were infected with S. sonnei (WT or ΔospC1/C3) at MOI 30 and treated with IFNβ (B), IFNλ1 (C), or IFNγ (D). Cells were lysed, and Shigella colony forming units (CFU) were enumerated at 1, 3, and 5 h postinfection (h.p.i). (E–G) T84wt or cells that lack type I and type III IFN receptors (IFNR dKO, purple lines, E), type I IFN receptor (IFNAR KO, blue lines, F) or type III IFN receptor (IFNLR KO, red lines, G) were infected with WT (plain lines) or ΔospC1/C3 Shigella (dashed lines) at MOI 30. Shigella CFUs were enumerated at the indicated time points and plotted as fold replication following normalization over the 1 h time point for each condition. Data show means ± SEM of at least 3 independent experiments. Statistical analyses were performed by two-way ANOVA. p < 0.05; ∗∗ p < 0.01; ∗∗∗ p < 0.001; ∗∗∗∗ p < 0.0001. See also Figure S7.
Figure 7
Figure 7
OspC effectors facilitate colonization of the murine intestine (A) WT or Ifnar−/− C57B/L6J mice treated with 20 mg of streptomycin sulfate were orally challenged the next day with streptomycin-resistant WT or ΔospC1/C3 Shigella. Endpoint harvest was performed at day 1 or 2 postinfection. (B and C) At day 1 postinfection, CFU were determined from the colon (B) and cecum (C) of WT mice. (D) Cxcl10, Viperin, and Ifit1 mRNA expression in the colon of uninfected (UI) or Shigella-infected WT mice were determined by qRT-PCR and calculated using the ΔΔCt method. Statistical significance was determined with one-way ANOVA. (E–G) Similarly to (B) and (C) except CFU were determined from colon, cecum, and spleen of WT or Ifnar−/− deficient mice 2 days postinfection. Data were not normally distributed, so were Log10 transformed prior to analysis. (B, C, and E–G) Statistical analysis was performed using unpaired Student’s t test. Symbols represent individual animals. Samples below the limit of detection are indicated by unfiled symbols. ns, nonsignificant; p < 0.05; ∗∗ p < 0.01; ∗∗∗ p < 0.001. See also Figure S8.
Figure S8
Figure S8
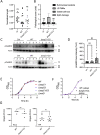
WT Shigella infection does not lead to inflammation but blocks CaMKII phosphorylation in vivo, related to Figure 7 and STAR Methods (A) Quantification of colon lengths in mice infected with WT or ΔospC1/C3 S. sonnei. Values were normalized to mouse weight prior to infection; colon length (cm)/mouse weight (g). UI, uninfected (circle symbols); WT, wild-type S. sonnei (square symbols); ΔospC1/C3 (triangle symbols). Data are representative of 3 experiments. Each symbol represents a mouse. (B) Blinded quantification of histology score from one representative experiment. Submucosal edema; LP PMNs, lamina propria polymorphonuclears; Goblet cell loss; Epith damage, epithelial damage, were scored from 0 to 4. The final score is the sum of individual scores from each category. Statistical analysis was performed by one-way ANOVA, comparing each condition to WT-infected condition. ns, nonsignificant. Data show mean ± SD of 1 experiment representative of 2. (C) Colon samples from mice infected with WT or ΔospC1/C3 S. sonnei were subjected to SDS-PAGE and western immunoblotting against phosphorylated CaMKII. Data shown are from 2 different experiments. Numbers represent individual mice for each condition. (D) Quantification of experiment shown in (C). Each symbol represents a mouse. Statistics were performed by one-way ANOVA, comparing each condition to uninfected (UI). Data represent the means ± SD of 8–10 mice per condition. (E and F) Native (E) and streptomycin-resistant (F) strains used in this study were grown in tryptic soy broth (TSB). OD600 was measured at the time points indicated. (G) HeLa (left panel) or T84 (right panel) epithelial cells were infected with wild type (WT) or ΔospC1/C3 Shigella at MOI 100 or 30 respectively. 30 min later, cells were washed and treated with gentamicin for an additional 30 min. Shigella colony forming units (CFU) were enumerated at 1 h postinfection. Statistical analysis was performed by Student’s t test. ns, nonsignificant; p < 0.05.

Comment in

References

    1. Alphonse N., Dickenson R.E., Odendall C. Interferons: tug of war between bacteria and their host. Front. Cell. Infect. Microbiol. 2021;11:624094. - PMC - PubMed
    1. Altschul S.F., Gish W., Miller W., Myers E.W., Lipman D.J. Basic local alignment search tool. J. Mol. Biol. 1990;215:403–410. - PubMed
    1. Anderson M.C., Vonaesch P., Saffarian A., Marteyn B.S., Sansonetti P.J. Shigella sonnei encodes a functional T6SS used for interbacterial competition and niche occupancy. Cell Host Microbe. 2017;21:769–776.e3. - PubMed
    1. Ashida H., Sasakawa C., Suzuki T. A unique bacterial tactic to circumvent the cell death crosstalk induced by blockade of caspase-8. EMBO J. 2020;39:e104469. - PMC - PubMed
    1. Bajunaid W., Haidar-Ahmad N., Kottarampatel A.H., Ourida Manigat F.O., Silué N., Tchagang C.F., Tomaro K., Campbell-Valois F.X. The t3ss of Shigella: expression, structure, function, and role in vacuole escape. Microorganisms. 2020;8:1–28. - PMC - PubMed

Publication types