Eye-specific 3D modeling of factors influencing oxygen concentration in the lamina cribrosa
- PMID: 35568202
- PMCID: PMC11007759
- DOI: 10.1016/j.exer.2022.109105
Eye-specific 3D modeling of factors influencing oxygen concentration in the lamina cribrosa
Abstract
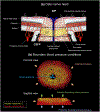
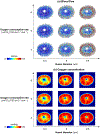
Our goal was to identify the factors with the strongest influence on the minimum lamina cribrosa (LC) oxygen concentration as potentially indicative of conditions increasing hypoxia risk. Because direct measurement of LC hemodynamics and oxygenation is not yet possible, we developed 3D eye-specific LC vasculature models. The vasculature of a normal monkey eye was perfusion-labeled post-mortem. Serial cryosections through the optic nerve head were imaged using fluorescence and polarized light microscopy to visualize the vasculature and collagen, respectively. The vasculature within a 450 μm-thick region containing the LC - identified from the collagen, was segmented, skeletonized, and meshed for simulations. Using Monte Carlo sampling, 200 vascular network models were generated with varying vessel diameter, neural tissue oxygen consumption rate, inflow hematocrit, and blood pressures (arteriole, venule, anterior boundary, and posterior boundary). Factors were varied over ranges of baseline ±20% with uniform probability. For each model we first obtained the blood flow, and from this the neural tissue oxygen concentration. ANOVA was used to identify the factors with the strongest influence on the minimum (10th percentile) oxygen concentration in the LC. The three most influential factors were, in ranked order, vessel diameter, neural tissue oxygen consumption rate, and arteriole pressure. There was a strong interaction between vessel diameter and arteriole pressure whereby the impact of one factor was larger when the other factor was small. Our results show that, for the eye analyzed, conditions that reduce vessel diameter, such as vessel compression due to elevated intraocular pressure or gaze-induced tissue deformation, may particularly contribute to decreased LC oxygen concentration. More eyes must be analyzed before generalizing.
Keywords: Blood flow; Glaucoma; Hemodynamics; Lamina cribrosa; Oxygen; Vasculature.
Copyright © 2022 Elsevier Ltd. All rights reserved.
Conflict of interest statement
Figures


Similar articles
-
Impact of anatomic variability and other vascular factors on lamina cribrosa hypoxia.bioRxiv [Preprint]. 2024 Sep 13:2024.09.12.610282. doi: 10.1101/2024.09.12.610282. bioRxiv. 2024. PMID: 39314360 Free PMC article. Preprint.
-
Finite element modeling of optic nerve head biomechanics.Invest Ophthalmol Vis Sci. 2004 Dec;45(12):4378-87. doi: 10.1167/iovs.04-0133. Invest Ophthalmol Vis Sci. 2004. PMID: 15557446
-
Lamina cribrosa vessel and collagen beam networks are distinct.Exp Eye Res. 2022 Feb;215:108916. doi: 10.1016/j.exer.2021.108916. Epub 2021 Dec 29. Exp Eye Res. 2022. PMID: 34973204 Free PMC article.
-
Altering the way the optic nerve head responds to intraocular pressure-a potential approach to glaucoma therapy.Curr Opin Pharmacol. 2013 Feb;13(1):83-9. doi: 10.1016/j.coph.2012.09.001. Epub 2012 Sep 19. Curr Opin Pharmacol. 2013. PMID: 22999652 Review.
-
The interaction between intracranial pressure, intraocular pressure and lamina cribrosal compression in glaucoma.Clin Exp Optom. 2016 May;99(3):219-26. doi: 10.1111/cxo.12333. Epub 2016 Apr 15. Clin Exp Optom. 2016. PMID: 27079432 Review.
Cited by
-
Computational study of the mechanical behavior of the astrocyte network and axonal compartments in the mouse optic nerve head.Biomech Model Mechanobiol. 2023 Oct;22(5):1751-1772. doi: 10.1007/s10237-023-01752-z. Epub 2023 Aug 13. Biomech Model Mechanobiol. 2023. PMID: 37573553 Free PMC article.
-
The Robust Lamina Cribrosa Vasculature: Perfusion and Oxygenation Under Elevated Intraocular Pressure.Invest Ophthalmol Vis Sci. 2024 May 1;65(5):1. doi: 10.1167/iovs.65.5.1. Invest Ophthalmol Vis Sci. 2024. PMID: 38691092 Free PMC article.
-
Impact of anatomic variability and other vascular factors on lamina cribrosa hypoxia.bioRxiv [Preprint]. 2024 Sep 13:2024.09.12.610282. doi: 10.1101/2024.09.12.610282. bioRxiv. 2024. PMID: 39314360 Free PMC article. Preprint.
-
Proposing a Methodology for Axon-Centric Analysis of IOP-Induced Mechanical Insult.Invest Ophthalmol Vis Sci. 2024 Nov 4;65(13):1. doi: 10.1167/iovs.65.13.1. Invest Ophthalmol Vis Sci. 2024. PMID: 39495185 Free PMC article.
-
Impact of Elevated Intraocular Pressure on Lamina Cribrosa Oxygenation: A Combined Experimental-Computational Study on Monkeys.Ophthalmol Sci. 2025 Jan 31;5(3):100725. doi: 10.1016/j.xops.2025.100725. eCollection 2025 May-Jun. Ophthalmol Sci. 2025. PMID: 40161464 Free PMC article.
References
-
- Alarcon-Martinez L, Villafranca-Baughman D, Quintero H, Kacerovsky JB, Dotigny F, Murai KK, Prat A, Drapeau P, Di Polo A, 2020. Interpericyte tunnelling nanotubes regulate neurovascular coupling. Nature 585, 91–95. - PubMed
-
- Anderson MJ, Whitcomb PJ, 2017. DOE simplified: practical tools for effective experimentation. CRC press.
-
- Bonomi L, Marchini G, Marraffa M, Bernardi P, Morbio R, Varotto A, 2000. Vascular risk factors for primary open angle glaucoma: the Egna-Neumarkt Study. Ophthalmology 107, 1287–1293. - PubMed
Publication types
MeSH terms
Substances
Grants and funding
LinkOut - more resources
Full Text Sources

