

Forecasting the transmission trends of respiratory infectious diseases with an exposure-risk-based model at the microscopic level
- PMID: 35568232
- PMCID: PMC9095069
- DOI: 10.1016/j.envres.2022.113428
Forecasting the transmission trends of respiratory infectious diseases with an exposure-risk-based model at the microscopic level
Abstract
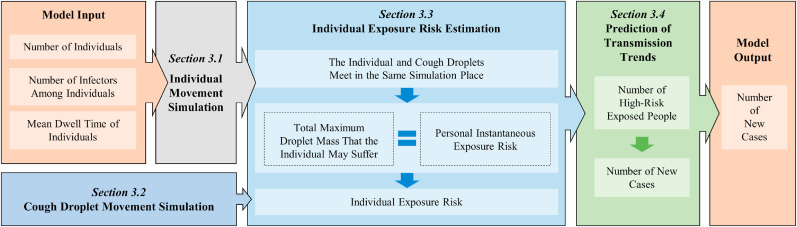
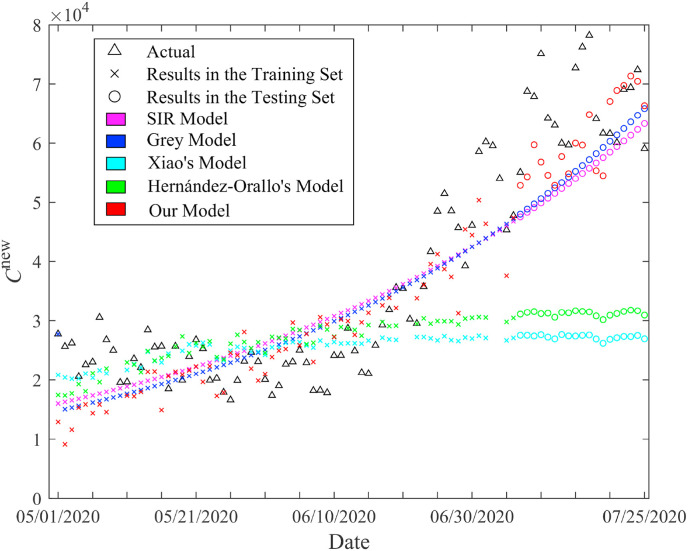
Respiratory infectious diseases (e.g., COVID-19) have brought huge damages to human society, and the accurate prediction of their transmission trends is essential for both the health system and policymakers. Most related studies focus on epidemic trend forecasting at the macroscopic level, which ignores the microscopic social interactions among individuals. Meanwhile, current microscopic models are still not able to sufficiently decipher the individual-based spreading process and lack valid quantitative tests. To tackle these problems, we propose an exposure-risk-based model at the microscopic level, including 4 modules: individual movement, virion-laden droplet movement, individual exposure risk estimation, and prediction of transmission trends. Firstly, the front two modules reproduce the movements of individuals and the droplets of infectors' expiratory activities, respectively. Then, the outputs are fed to the third module to estimate the personal exposure risk. Finally, the number of new cases is predicted in the final module. By predicting the new COVID- 19 cases in the United States, the performances of our model and 4 other existing macroscopic or microscopic models are compared. Specifically, the mean absolute error, root mean square error, and mean absolute percentage error provided by the proposed model are respectively 2454.70, 3170.51, and 3.38% smaller than the minimum results of comparison models. The quantitative results reveal that our model can accurately predict the transmission trends from a microscopic perspective, and it can benefit the further investigation of many microscopic disease transmission factors (e.g., non-walkable areas and facility layouts).
Keywords: COVID-19; Environmental epidemiology; Exposure risk; Microscopic model; Public health; Respiratory infectious diseases.
Copyright © 2022 Elsevier Inc. All rights reserved.
Conflict of interest statement
The authors declare that they have no known competing financial interests or personal relationships that could have appeared to influence the work reported in this paper.
Figures
References
-
- Abdul Salam P.S., Bock W., Klar A., Tiwari S. Disease contagion models coupled to crowd motion and mesh-free simulation. Math. Model Methods Appl. Sci. 2021;31(6):1277–1295.
-
- Aliabadi A.A., Rogak S.N., Green S.I., Bartlett K.H. CFD simulation of human coughs and sneezes: a study in droplet dispersion, heat, and mass transfer. Proceedings of the ASME international mechanical engineering congress and exposition. 2010;7:1051–1060.
Publication types
MeSH terms
LinkOut - more resources
Full Text Sources
Medical
