

Soil and landscape factors influence geospatial variation in maize grain zinc concentration in Malawi
- PMID: 35568698
- PMCID: PMC9107474
- DOI: 10.1038/s41598-022-12014-w
Soil and landscape factors influence geospatial variation in maize grain zinc concentration in Malawi
Abstract
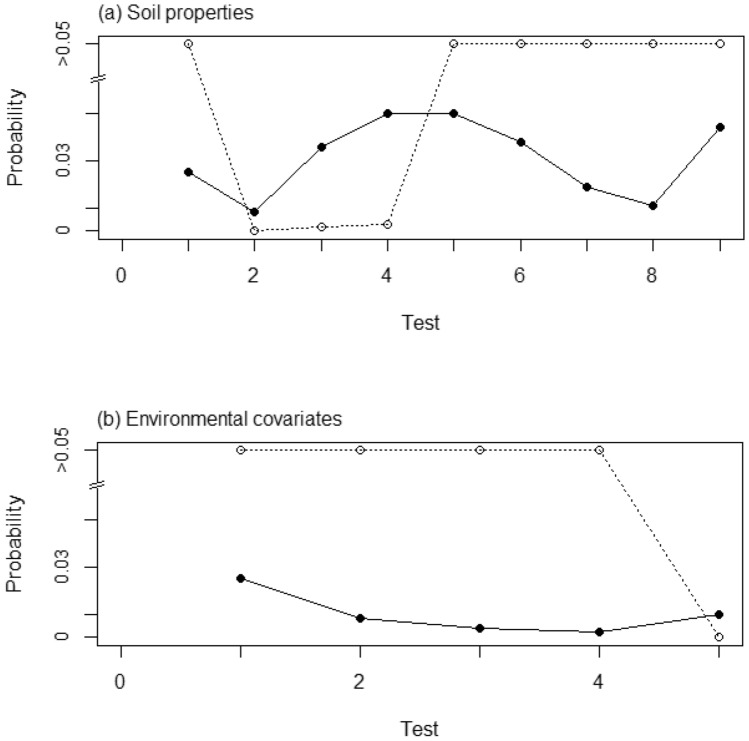
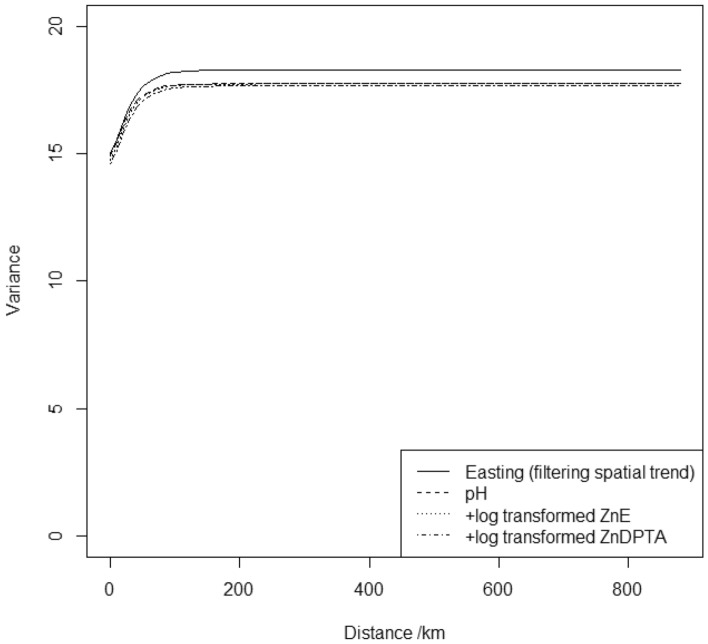
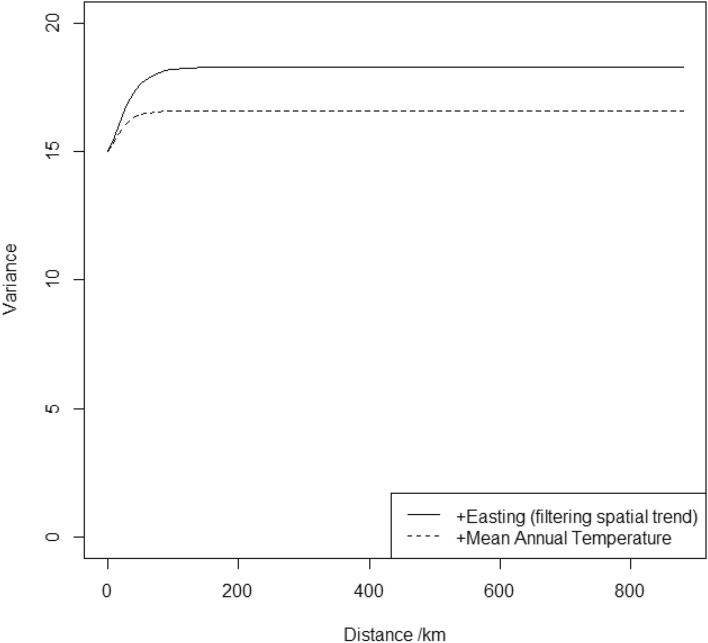
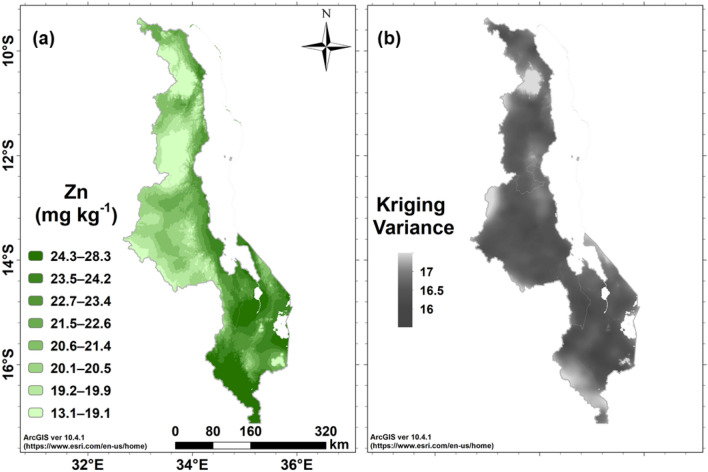
Dietary zinc (Zn) deficiency is widespread globally, and in particular among people in sub-Saharan Africa (SSA). In Malawi, dietary sources of Zn are dominated by maize and spatially dependent variation in grain Zn concentration, which will affect dietary Zn intake, has been reported at distances of up to ~ 100 km. The aim of this study was to identify potential soil properties and environmental covariates which might explain this longer-range spatial variation in maize grain Zn concentration. Data for maize grain Zn concentrations, soil properties, and environmental covariates were obtained from a spatially representative survey in Malawi (n = 1600 locations). Labile and non-labile soil Zn forms were determined using isotopic dilution methods, alongside conventional agronomic soil analyses. Soil properties and environmental covariates as potential predictors of the concentration of Zn in maize grain were tested using a priori expert rankings and false discovery rate (FDR) controls within the linear mixed model (LMM) framework that informed the original survey design. Mean and median grain Zn concentrations were 21.8 and 21.5 mg kg-1, respectively (standard deviation 4.5; range 10.0-48.1). A LMM for grain Zn concentration was constructed for which the independent variables: soil pH(water), isotopically exchangeable Zn (ZnE), and diethylenetriaminepentaacetic acid (DTPA) extractable Zn (ZnDTPA) had predictive value (p < 0.01 in all cases, with FDR controlled at < 0.05). Downscaled mean annual temperature also explained a proportion of the spatial variation in grain Zn concentration. Evidence for spatially dependent variation in maize grain Zn concentrations in Malawi is robust within the LMM framework used in this study, at distances of up to ~ 100 km. Spatial predictions from this LMM provide a basis for further investigation of variations in the contribution of staple foods to Zn nutrition, and where interventions to increase dietary Zn intake (e.g. biofortification) might be most effective. Other soil and landscape factors influencing spatially dependent variation in maize grain Zn concentration, along with factors operating over shorter distances such as choice of crop variety and agronomic practices, require further exploration beyond the scope of the design of this survey.
© 2022. The Author(s).
Conflict of interest statement
The authors declare no competing interests.
Figures
References
-
- Gregory PJ, et al. Approaches to reduce zinc and iron deficits in food systems. Glob. Food Sec. 2017;15:1–10. doi: 10.1016/j.gfs.2017.03.003. - DOI
Publication types
MeSH terms
Substances
Grants and funding
LinkOut - more resources
Full Text Sources
Research Materials
