

Sex differences in global metabolomic profiles of COVID-19 patients
- PMID: 35568706
- PMCID: PMC9106988
- DOI: 10.1038/s41419-022-04861-2
Sex differences in global metabolomic profiles of COVID-19 patients
Abstract
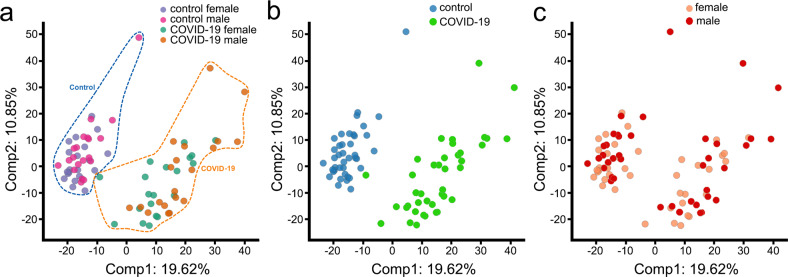
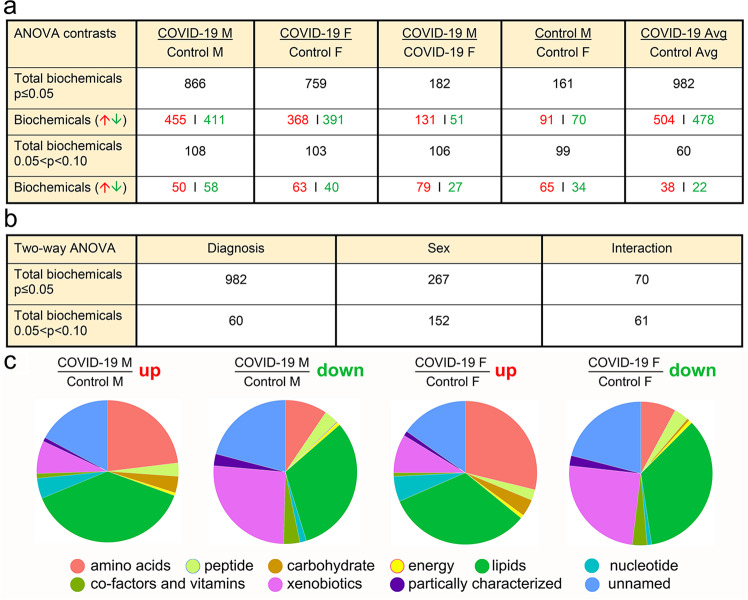
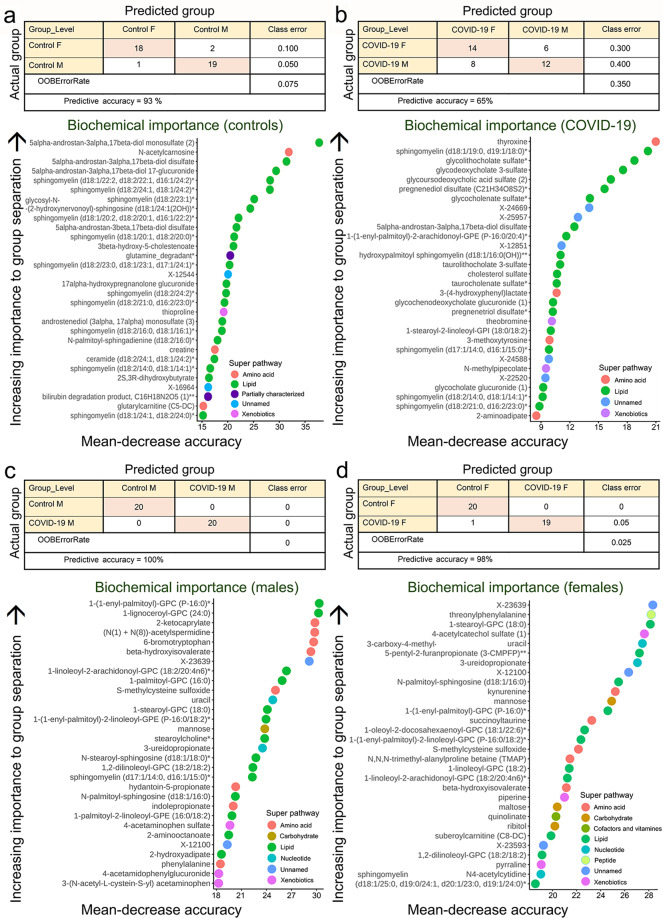
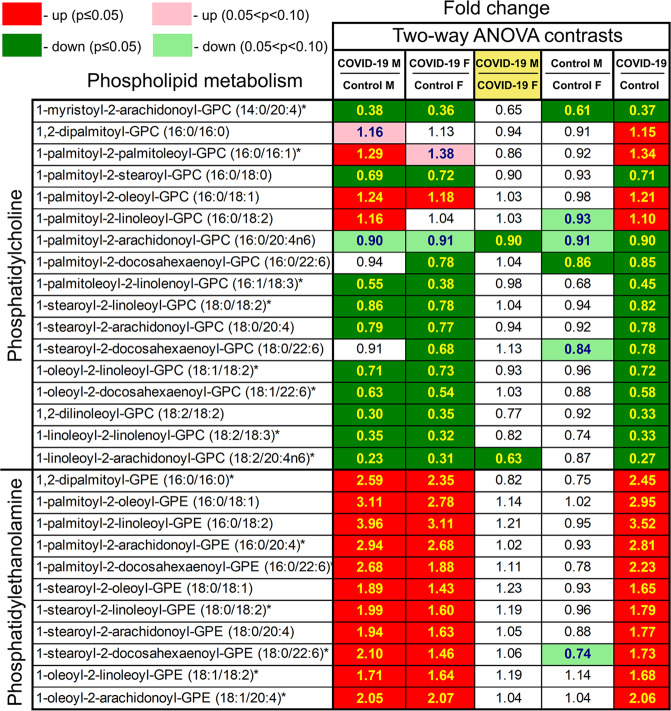
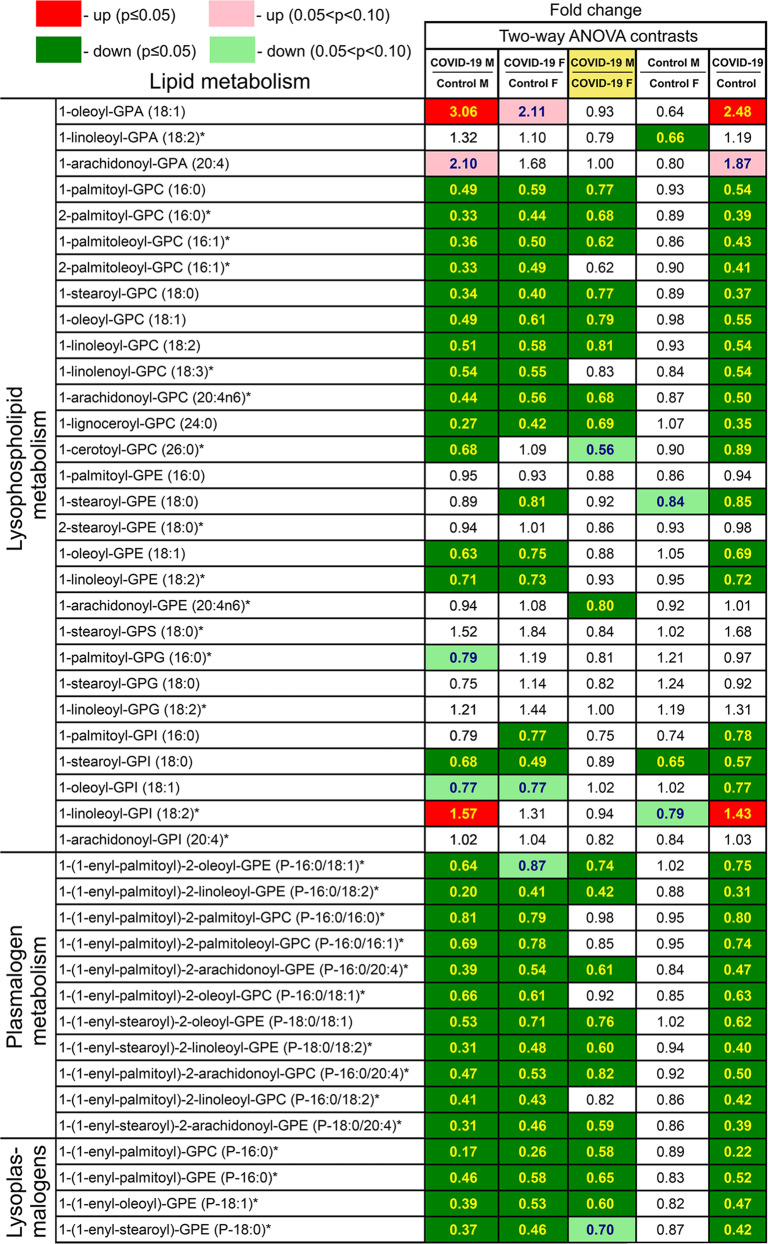
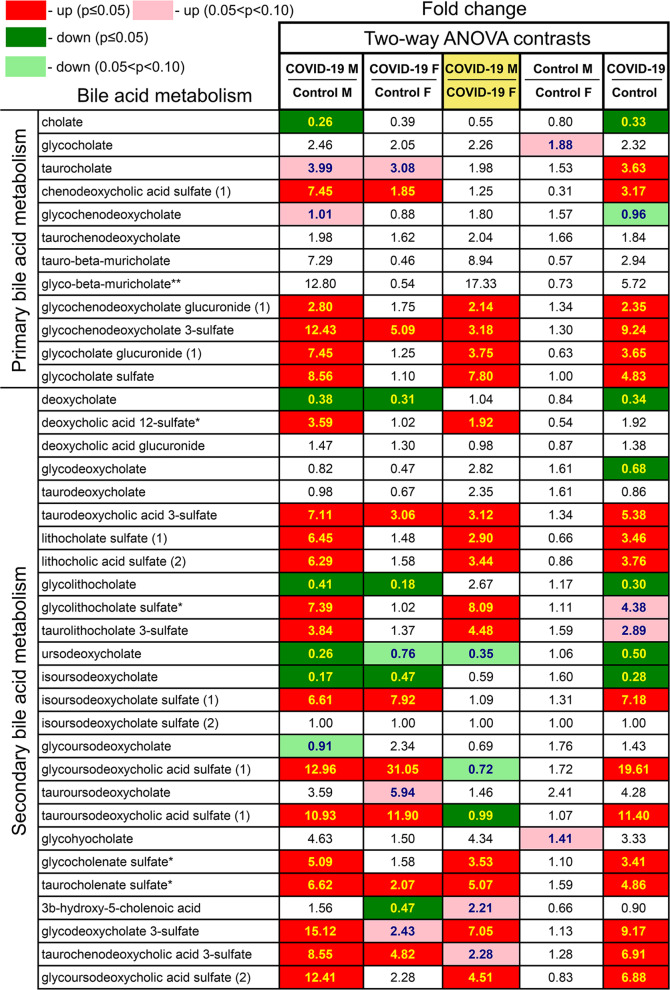
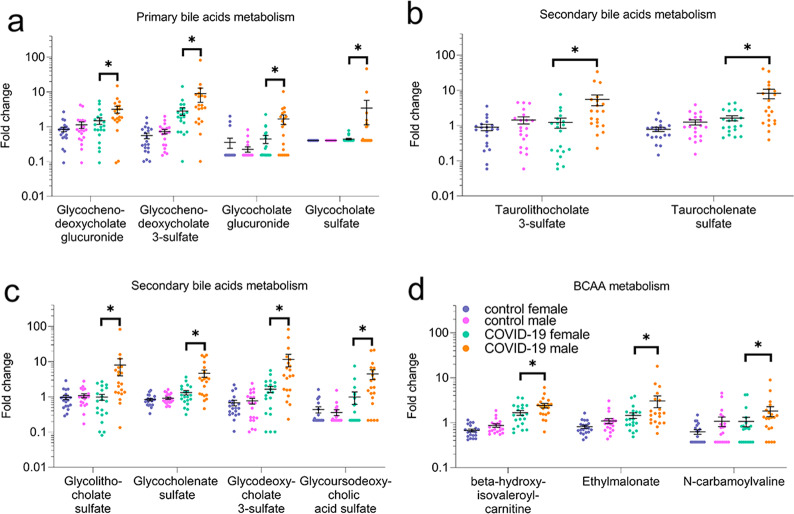
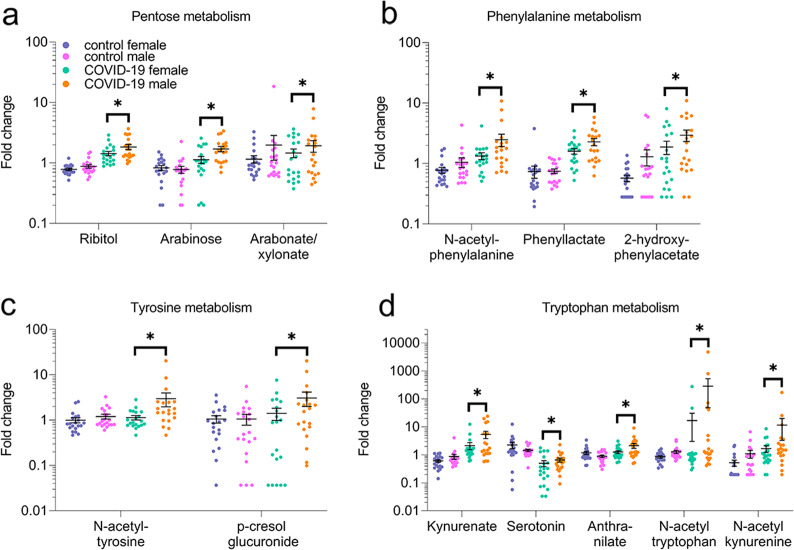
Coronavirus disease (COVID-19), caused by SARS-CoV-2, leads to symptoms ranging from asymptomatic disease to death. Although males are more susceptible to severe symptoms and higher mortality due to COVID-19, patient sex has rarely been examined. Sex-associated metabolic changes may implicate novel biomarkers and therapeutic targets to treat COVID-19. Here, using serum samples, we performed global metabolomic analyses of uninfected and SARS-CoV-2-positive male and female patients with severe COVID-19. Key metabolic pathways that demonstrated robust sex differences in COVID-19 groups, but not in controls, involved lipid metabolism, pentose pathway, bile acid metabolism, and microbiome-related metabolism of aromatic amino acids, including tryptophan and tyrosine. Unsupervised statistical analysis showed a profound sexual dimorphism in correlations between patient-specific clinical parameters and their global metabolic profiles. Identification of sex-specific metabolic changes in severe COVID-19 patients is an important knowledge source for researchers striving for development of potential sex-associated biomarkers and druggable targets for COVID-19 patients.
© 2022. The Author(s).
Conflict of interest statement
The authors declare no competing interests.
Figures
Similar articles
-
Amino Acid Metabolism is Significantly Altered at the Time of Admission in Hospital for Severe COVID-19 Patients: Findings from Longitudinal Targeted Metabolomics Analysis.Microbiol Spectr. 2021 Dec 22;9(3):e0033821. doi: 10.1128/spectrum.00338-21. Epub 2021 Dec 8. Microbiol Spectr. 2021. PMID: 34878333 Free PMC article.
-
Sera Metabolomics Characterization of Patients at Different Stages in Wuhan Identifies Critical Biomarkers of COVID-19.Front Cell Infect Microbiol. 2022 May 2;12:882661. doi: 10.3389/fcimb.2022.882661. eCollection 2022. Front Cell Infect Microbiol. 2022. PMID: 35586248 Free PMC article.
-
Metabolic predictors of COVID-19 mortality and severity: a survival analysis.Front Immunol. 2024 May 10;15:1353903. doi: 10.3389/fimmu.2024.1353903. eCollection 2024. Front Immunol. 2024. PMID: 38799469 Free PMC article.
-
Metabolomic characteristics and related pathways in patients with different severity of COVID-19: a systematic review and meta-analysis.J Glob Health. 2025 Feb 28;15:04056. doi: 10.7189/jogh.15.04056. J Glob Health. 2025. PMID: 40019163 Free PMC article.
-
Progress in understanding COVID-19: insights from the omics approach.Crit Rev Clin Lab Sci. 2021 Jun;58(4):242-252. doi: 10.1080/10408363.2020.1851167. Epub 2020 Dec 29. Crit Rev Clin Lab Sci. 2021. PMID: 33375876 Review.
Cited by
-
Comprehensive investigation of pathway enrichment methods for functional interpretation of LC-MS global metabolomics data.Brief Bioinform. 2023 Jan 19;24(1):bbac553. doi: 10.1093/bib/bbac553. Brief Bioinform. 2023. PMID: 36572652 Free PMC article.
-
Integrated NMR and MS Analysis of the Plasma Metabolome Reveals Major Changes in One-Carbon, Lipid, and Amino Acid Metabolism in Severe and Fatal Cases of COVID-19.Metabolites. 2023 Jul 24;13(7):879. doi: 10.3390/metabo13070879. Metabolites. 2023. PMID: 37512587 Free PMC article.
-
Morphologic Findings in the Cerebral Cortex in COVID-19: Association of Microglial Changes with Clinical and Demographic Variables.Biomedicines. 2023 May 9;11(5):1407. doi: 10.3390/biomedicines11051407. Biomedicines. 2023. PMID: 37239078 Free PMC article.
-
Setting Ranges in Potential Biomarkers for Type 2 Diabetes Mellitus Patients Early Detection By Sex-An Approach with Machine Learning Algorithms.Diagnostics (Basel). 2024 Jul 27;14(15):1623. doi: 10.3390/diagnostics14151623. Diagnostics (Basel). 2024. PMID: 39125499 Free PMC article.
-
Cholesterol and Cholesterol-Lowering Medications in COVID-19-An Unresolved Matter.Int J Mol Sci. 2024 Sep 29;25(19):10489. doi: 10.3390/ijms251910489. Int J Mol Sci. 2024. PMID: 39408818 Free PMC article. Review.
References
-
- Vahidy FS, Pan AP, Ahnstedt H, Munshi Y, Choi HA, Tiruneh Y, et al. Sex differences in susceptibility, severity, and outcomes of coronavirus disease 2019: Cross-sectional analysis from a diverse US metropolitan area. PLoS ONE. 2021;16:e0245556. doi: 10.1371/journal.pone.0245556. - DOI - PMC - PubMed
Publication types
MeSH terms
Substances
Grants and funding
LinkOut - more resources
Full Text Sources
Medical
Miscellaneous
