

Ultrasound-assisted carbon ion dosimetry and range measurement using injectable polymer-shelled phase-change nanodroplets: in vitro study
- PMID: 35568710
- PMCID: PMC9107472
- DOI: 10.1038/s41598-022-11524-x
Ultrasound-assisted carbon ion dosimetry and range measurement using injectable polymer-shelled phase-change nanodroplets: in vitro study
Abstract
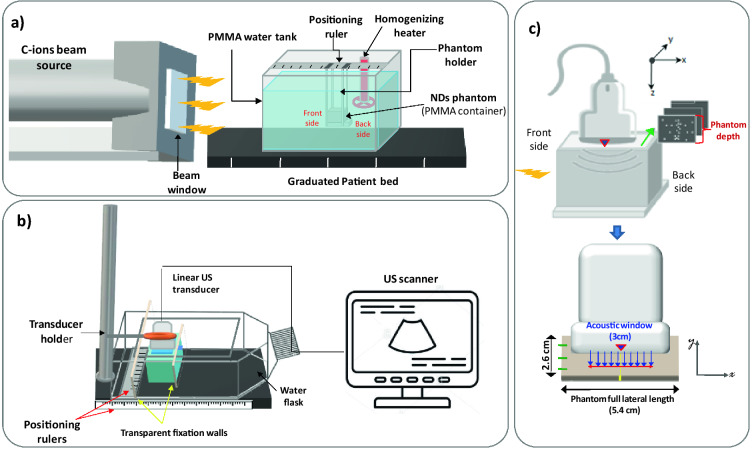
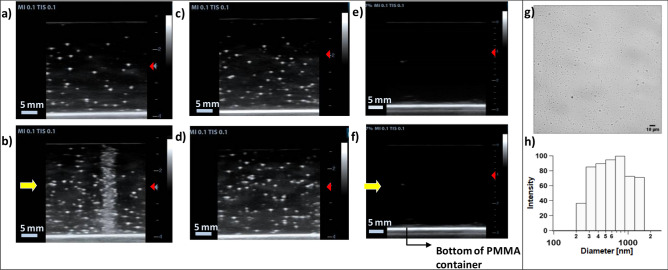
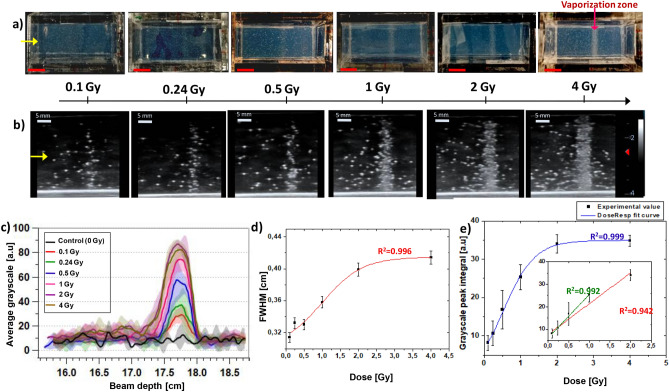
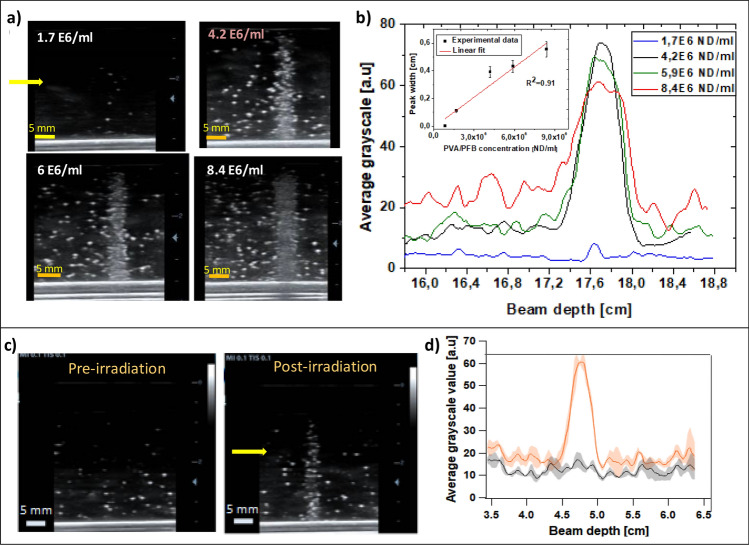
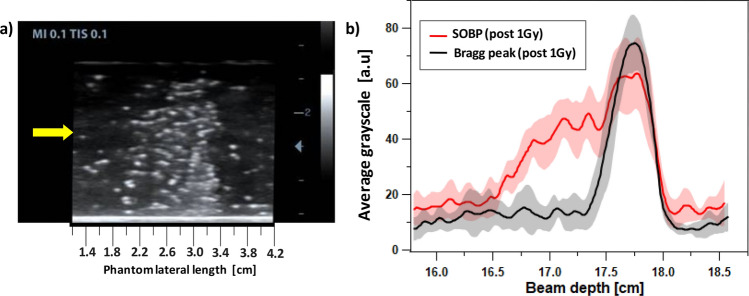
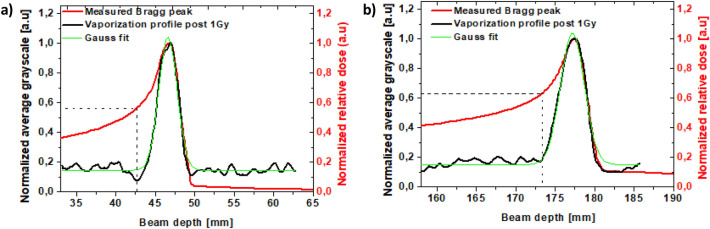
Methods allowing for in situ dosimetry and range verification are essential in radiotherapy to reduce the safety margins required to account for uncertainties introduced in the entire treatment workflow. This study suggests a non-invasive dosimetry concept for carbon ion radiotherapy based on phase-change ultrasound contrast agents. Injectable nanodroplets made of a metastable perfluorobutane (PFB) liquid core, stabilized with a crosslinked poly(vinylalcohol) shell, are vaporized at physiological temperature when exposed to carbon ion radiation (C-ions), converting them into echogenic microbubbles. Nanodroplets, embedded in tissue-mimicking phantoms, are exposed at 37 °C to a 312 MeV/u clinical C-ions beam at different doses between 0.1 and 4 Gy. The evaluation of the contrast enhancement from ultrasound imaging of the phantoms, pre- and post-irradiation, reveals a significant radiation-triggered nanodroplets vaporization occurring at the C-ions Bragg peak with sub-millimeter shift reproducibility and dose dependency. The specific response of the nanodroplets to C-ions is further confirmed by varying the phantom position, the beam range, and by performing spread-out Bragg peak irradiation. The nanodroplets' response to C-ions is influenced by their concentration and is dose rate independent. These early findings show the ground-breaking potential of polymer-shelled PFB nanodroplets to enable in vivo carbon ion dosimetry and range verification.
© 2022. The Author(s).
Conflict of interest statement
The authors declare no competing interests.
Figures
Similar articles
-
Size-Sorted Superheated Nanodroplets for Dosimetry and Range Verification of Carbon-Ion Radiotherapy.Nanomaterials (Basel). 2024 Oct 13;14(20):1643. doi: 10.3390/nano14201643. Nanomaterials (Basel). 2024. PMID: 39452979 Free PMC article.
-
Modulating ultrasound contrast generation from injectable nanodroplets for proton range verification by varying the degree of superheat.Med Phys. 2021 Apr;48(4):1983-1995. doi: 10.1002/mp.14778. Epub 2021 Mar 11. Med Phys. 2021. PMID: 33587754
-
Ultrasound-assisted investigation of photon triggered vaporization of poly(vinylalcohol) phase-change nanodroplets: A preliminary concept study with dosimetry perspective.Phys Med. 2021 Sep;89:232-242. doi: 10.1016/j.ejmp.2021.08.006. Epub 2021 Aug 20. Phys Med. 2021. PMID: 34425514
-
Cavitation-facilitated transmembrane permeability enhancement induced by acoustically vaporized nanodroplets.Ultrason Sonochem. 2021 Nov;79:105790. doi: 10.1016/j.ultsonch.2021.105790. Epub 2021 Oct 13. Ultrason Sonochem. 2021. PMID: 34662804 Free PMC article. Review.
-
Gel dosimetry for the dose verification of intensity modulated radiotherapy treatments.Z Med Phys. 2002;12(2):77-88. doi: 10.1016/s0939-3889(15)70450-2. Z Med Phys. 2002. PMID: 12145912 Review.
Cited by
-
Perfluorobutane Nanodroplets for the Selective Sensing and Range Verification of Carbon-Ion Radiotherapy: In Vitro Evaluation on Cells.ACS Omega. 2025 Jun 30;10(27):29154-29165. doi: 10.1021/acsomega.5c01785. eCollection 2025 Jul 15. ACS Omega. 2025. PMID: 40687012 Free PMC article.
-
Size-Sorted Superheated Nanodroplets for Dosimetry and Range Verification of Carbon-Ion Radiotherapy.Nanomaterials (Basel). 2024 Oct 13;14(20):1643. doi: 10.3390/nano14201643. Nanomaterials (Basel). 2024. PMID: 39452979 Free PMC article.
References
-
- Opalka L, et al. 3D measurement of the radiation distribution in a water phantom in a hadron therapy beam. J. Inst. 2012;7:C01085–C01085.
Publication types
MeSH terms
Substances
LinkOut - more resources
Full Text Sources
Other Literature Sources
