. 2022 May 14;19(1):14.
doi: 10.1186/s12014-022-09352-2.

Transcriptome profiling and proteomic validation reveals targets of the androgen receptor signaling in the BT-474 breast cancer cell line

Affiliations

Transcriptome profiling and proteomic validation reveals targets of the androgen receptor signaling in the BT-474 breast cancer cell line

Stella K Vasiliou et al. Clin Proteomics. .

Abstract

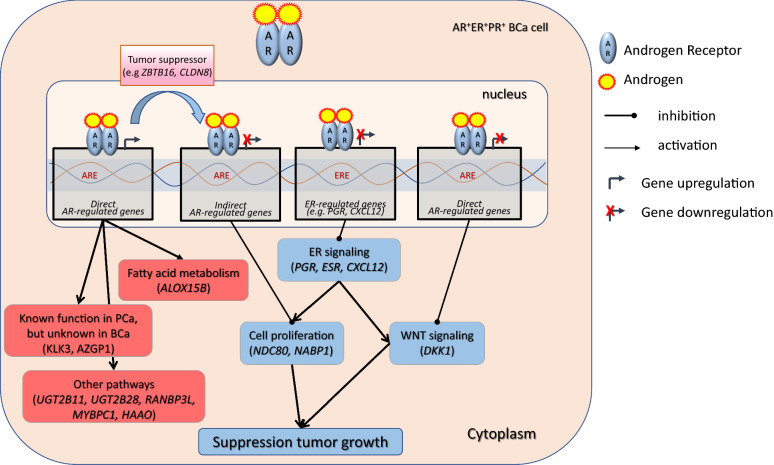
Background: Accumulating evidence suggests that the androgen receptor (AR) and its endogenous ligands influence disease progression in breast cancer (BCa). However, AR-mediated changes in BCa differ among the various BCa subtypes according to their hormone receptor profile [i.e., presence/absence of estrogen receptor (ER), progesterone receptor (PR) and human epidermal growth factor receptor 2, (HER2)]. Thus, we explored the androgen-regulated transcriptomic changes in the ER+PR+HER2+ BCa cell line, BT-474, and compared them with PR-mediated changes.

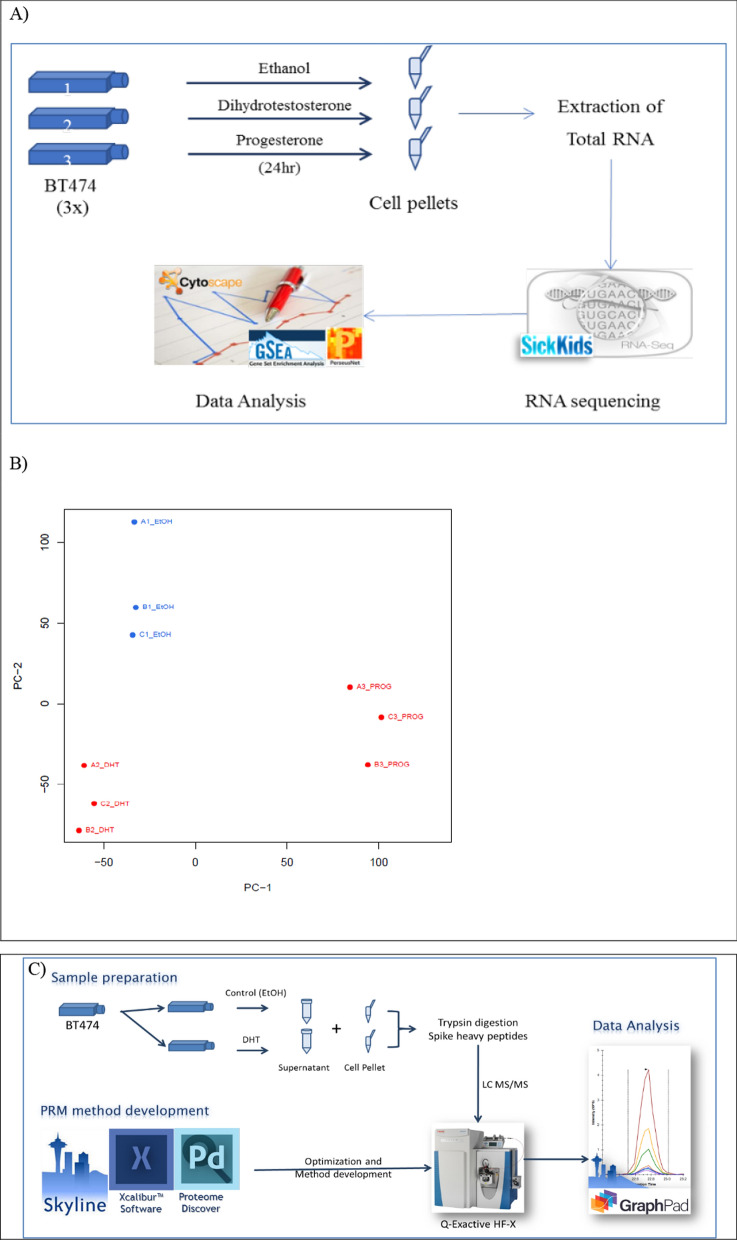
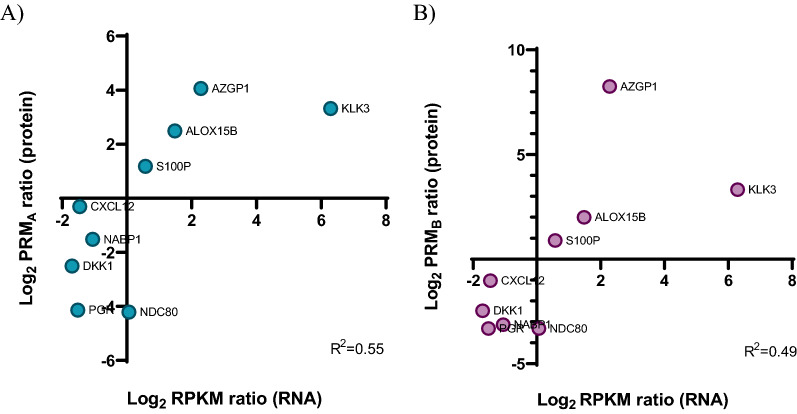
Methods: We performed RNA sequencing analysis in treated BT-474 cells with dihydrotestosterone (DHT) and progesterone. Validation of the top ten differentially androgen-regulated genes and a number of other genes found in enriched signaling pathways was performed by qRT-PCR in BT-474 and other BCa cell lines. In addition, a parallel reaction monitoring targeted proteomic approach was developed to verify selected transcripts at the protein level.

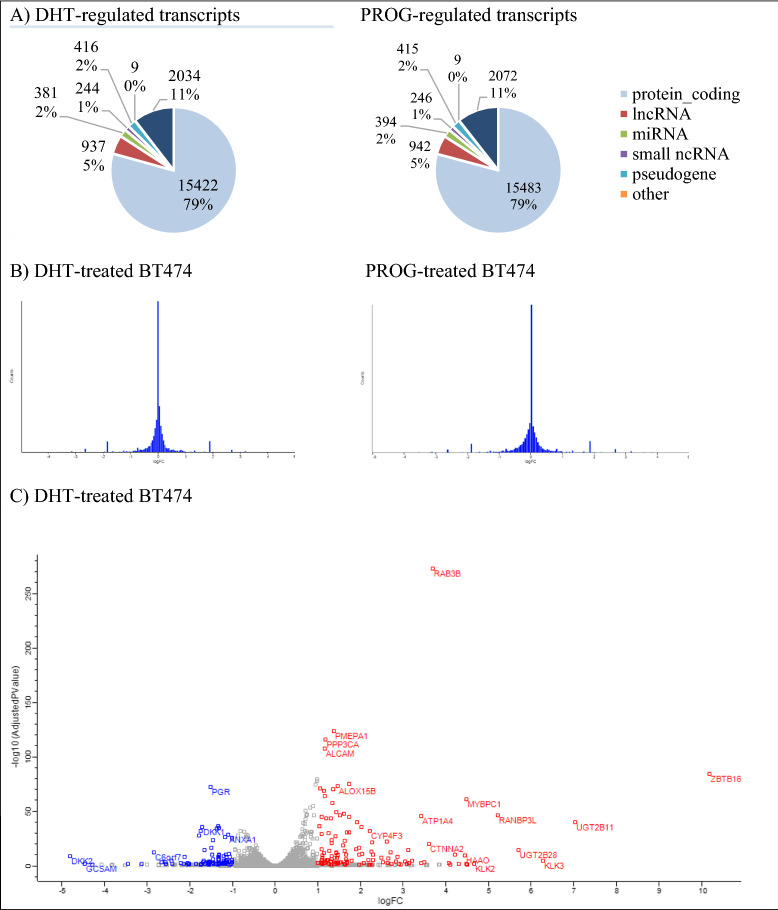
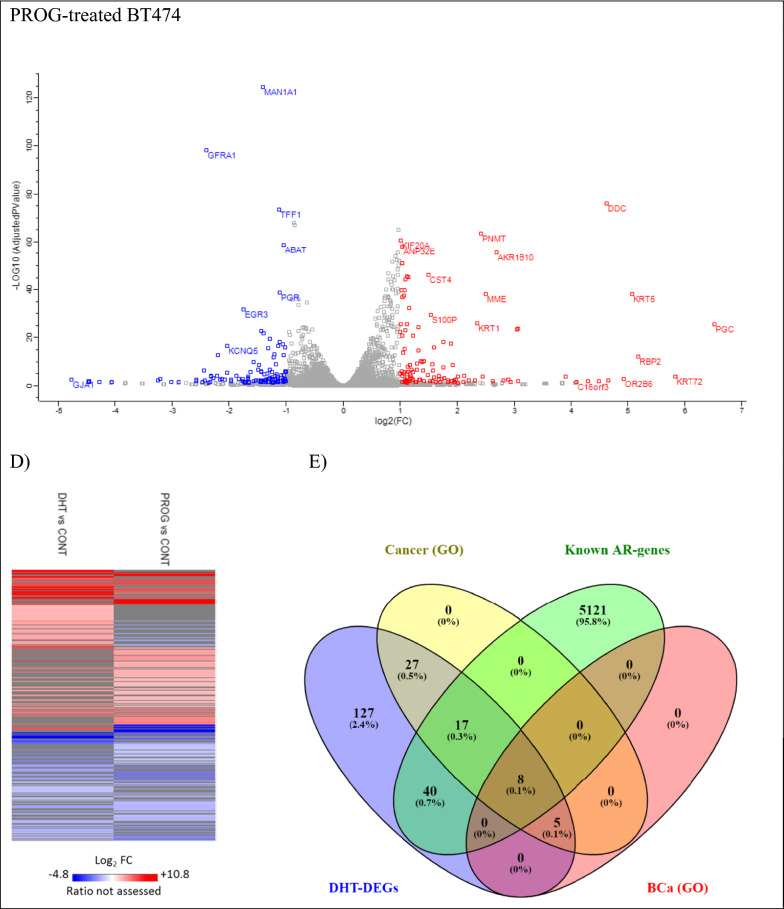
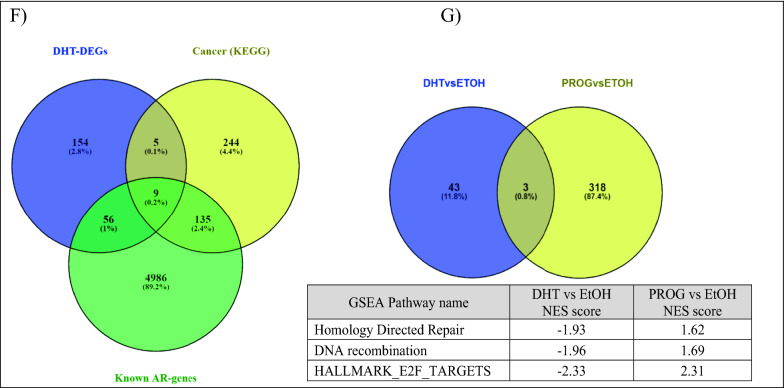
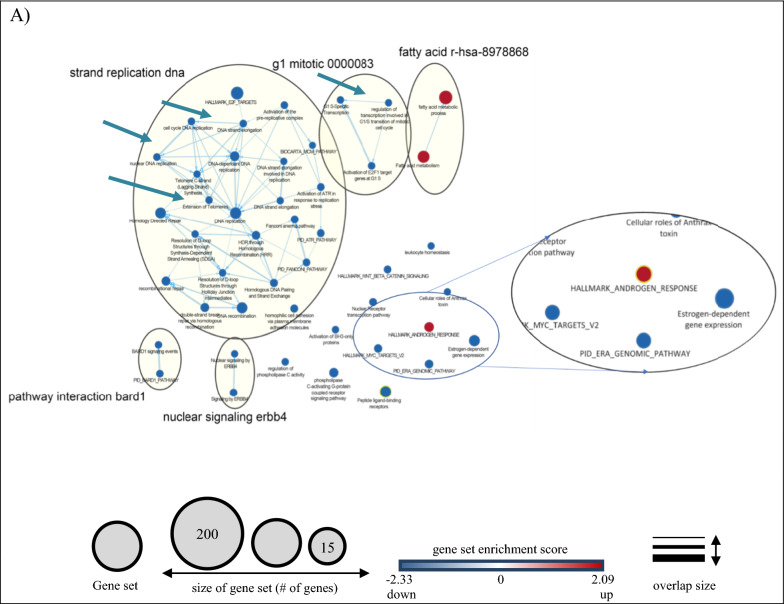
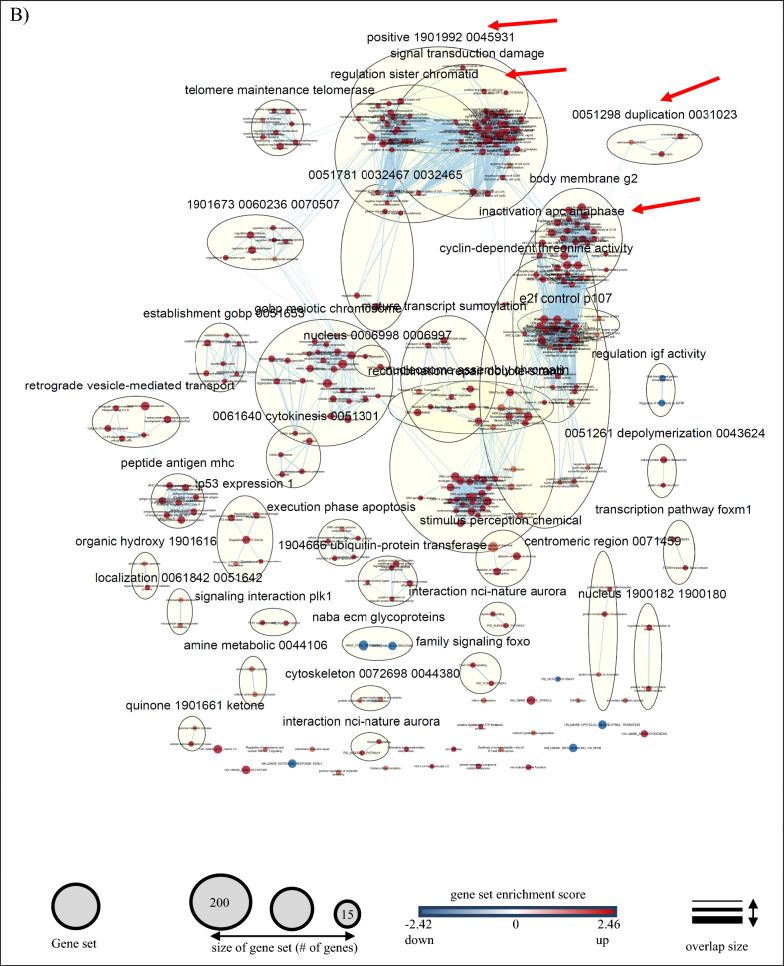
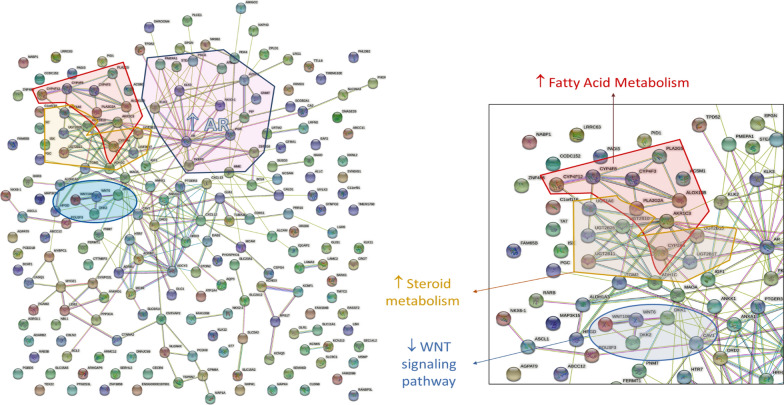
Results: In total 19,450 transcripts were detected, of which 224 were differentially regulated after DHT treatment. The increased expression of two well-known androgen-regulated genes, KLK2 (p < 0.05) and KLK3 (p < 0.001), confirmed the successful androgen stimulation in BT-474 cells. The transcription factor, ZBTB16, was the most highly upregulated gene, with ~ 1000-fold change (p < 0.001). Pathway enrichment analysis revealed downregulation of the DNA replication processes (p < 0.05) and upregulation of the androgen signaling and fatty acid metabolism pathways (p < 0.05). Changes related to progesterone treatment showed opposite effects in gene expression than DHT treatment. Similar expression profiles were observed among other BCa cell lines expressing high levels of AR (ZR75.1 and MBA-MB-453). The parallel reaction monitoring targeted proteomic analysis further confirmed that altered protein expression (KLK3, ALOX15B) in the supernatant and cell lysate of DHT-treated BT-474 cells, compared to control cells.

Discussion: Our findings suggest that AR modulates the metabolism of BT-474 cells by affecting the expression of a large number of genes and proteins. Based on further pathway analysis, we suggest that androgen receptor acts as a tumor suppressor in the BT-474 cells.

Keywords: Androgen receptor; BT-474; Breast cancer; Metabolism; RNA sequencing; Sex hormones; Transcriptome.


Conflict of interest statement

The authors declare that they have no competing interests.

Figures

Fig. 1
Fig. 1
Project pipeline. A Workflow of the transcriptomic analysis of hormonally treated BT474 cells. Cells were cultured and treated with hormones or ethanol (used as control) for 24 h. Cell pellets were collected and subjected to total RNA isolation. GSEA and Cytoscape software was used for the functional and pathway analysis of the differentially expressed genes. DHT dihydrotestosterone (10 nM), PROG progesterone (10 nM). B Principal Component Analysis (PCA) of BT474 RNA sequencing in three treatment conditions (Ethanol, DHT, and PROG). Each condition was performed in triplicates and groups clearly cluster. DHT dihydrotestosterone (10 nM), PROG progesterone (10 nM). C Experimental workflow of targeted PRM proteomics and data analysis for the validation of select androgen-regulated proteins in the BT474 cell line. For details see under “methods”
Fig. 2
Fig. 2
Hormonally regulated changes in the BT474 transcriptome. A Pie charts illustrating the different transcript types that are hormonally regulated in BT474 cells. In both conditions, DHT- and PROG-treated cells, 79% of the transcripts are protein-coding, 5% long non-coding RNAs (lncRNA), 2% microRNAs (miRNA), 2% small non-coding RNA (ncRNA), 2% pseudogenes, and the remaining 11% belong to other categories and gene ID duplications. *snoRNA, snRNA, scaRNA, scRNA, miscRNA. **Polymorphic_pseudogene, processed_pseudogene, transcribed_processed_pseudogene, transcribed_unitary_pseudogene, transcribed_unprocessed_ pseudogene, unitary_pseudogene, unprocessed_pseudogene. ***TEC (To be experimentally confirmed), ribosome The transcript categorization was performed on Ensembl website, using the bioinformatics tool, Biomart. B Histograms demonstrating the FC (fold change) distribution of DEGs in the transcript list, C Volcano plots illustrating the most significant differentially expressed genes. Red color shows the upregulated genes and blue color shows the downregulated genes. D Heatmap illustrating the differential expression profiles in DHT-treated and PROG-treated cells, respectively, compared to controls. Red color represents the upregulated genes, whereas the blue color represents the downregulated genes. Grey color corresponds to the genes that were not expressed, or the ratio could not be assessed in this experiment. All graphs were constructed in Perseus software using the log2FC values derived from the expression comparison between the hormone-treated and control cells. E, F Venn diagram representing the number and overlapping of DEGs in DHT-treated BT474 cells with known AR-regulated and cancer/BCa-related genes. The identification of the cancer/BCa related enriched genes were identified with the Gene Ontology annotation (E) and the KEGG analysis (F) of DAVID (2021 Update) online tool. G Comparison of gene set numbers identified in GSEA analysis of the RNA-seq experiment in DHT and PROG-treated BT474 cells. For the GSEA (v.3.0) analysis, only gene sets that contained 15–200 genes were used (q-value < 0.1). DHT dihydrotestosterone (10 nM), PROG progesterone (10 nM) *NES: normalized enrichment score
Fig. 2
Fig. 2
Hormonally regulated changes in the BT474 transcriptome. A Pie charts illustrating the different transcript types that are hormonally regulated in BT474 cells. In both conditions, DHT- and PROG-treated cells, 79% of the transcripts are protein-coding, 5% long non-coding RNAs (lncRNA), 2% microRNAs (miRNA), 2% small non-coding RNA (ncRNA), 2% pseudogenes, and the remaining 11% belong to other categories and gene ID duplications. *snoRNA, snRNA, scaRNA, scRNA, miscRNA. **Polymorphic_pseudogene, processed_pseudogene, transcribed_processed_pseudogene, transcribed_unitary_pseudogene, transcribed_unprocessed_ pseudogene, unitary_pseudogene, unprocessed_pseudogene. ***TEC (To be experimentally confirmed), ribosome The transcript categorization was performed on Ensembl website, using the bioinformatics tool, Biomart. B Histograms demonstrating the FC (fold change) distribution of DEGs in the transcript list, C Volcano plots illustrating the most significant differentially expressed genes. Red color shows the upregulated genes and blue color shows the downregulated genes. D Heatmap illustrating the differential expression profiles in DHT-treated and PROG-treated cells, respectively, compared to controls. Red color represents the upregulated genes, whereas the blue color represents the downregulated genes. Grey color corresponds to the genes that were not expressed, or the ratio could not be assessed in this experiment. All graphs were constructed in Perseus software using the log2FC values derived from the expression comparison between the hormone-treated and control cells. E, F Venn diagram representing the number and overlapping of DEGs in DHT-treated BT474 cells with known AR-regulated and cancer/BCa-related genes. The identification of the cancer/BCa related enriched genes were identified with the Gene Ontology annotation (E) and the KEGG analysis (F) of DAVID (2021 Update) online tool. G Comparison of gene set numbers identified in GSEA analysis of the RNA-seq experiment in DHT and PROG-treated BT474 cells. For the GSEA (v.3.0) analysis, only gene sets that contained 15–200 genes were used (q-value < 0.1). DHT dihydrotestosterone (10 nM), PROG progesterone (10 nM) *NES: normalized enrichment score
Fig. 3
Fig. 3
Pathway analysis of hormone-regulated genes identified by RNA sequencing of BT474 cells. Enrichment map of the DHT- (A) and PROG- (B) regulated genes. The analysis was performed using the Cytoscape software (GSEA 3.0, Enrichment Map plugin, q-value < 0.1). Blue color nodes represent downregulated gene sets, whereas red color nodes show the upregulated gene sets. The node size corresponds to the number of genes included within each gene set. For details see under Section “methods”
Fig. 3
Fig. 3
Pathway analysis of hormone-regulated genes identified by RNA sequencing of BT474 cells. Enrichment map of the DHT- (A) and PROG- (B) regulated genes. The analysis was performed using the Cytoscape software (GSEA 3.0, Enrichment Map plugin, q-value < 0.1). Blue color nodes represent downregulated gene sets, whereas red color nodes show the upregulated gene sets. The node size corresponds to the number of genes included within each gene set. For details see under Section “methods”
Fig. 4
Fig. 4
Schematic representation of the significant DEGs of DHT-regulated BT474 cells, using the online tool, STRING. The genes associated with either fatty acid metabolism or the WNT-pathway, cluster clearly together. Lines with different colors represent the source of data that indicate the protein–protein interaction light blue: from curated databases, purple: experimentally determined, green: gene neighborhood, red: gene fusions, dark blue: gene co-occurrence, yellow: text mining, black: co-expression, and grey: protein homology
Fig. 5
Fig. 5
Pearson correlation analysis between the transcript and protein levels of DHT-regulated genes in BT474 cells. The X axis shows the transcriptomic (log2 RPKM ratio) and the Y axis the proteomic (log2 PRM ratio) levels of DHT-treated BT474 cells. The graphs A and B show the comparison of the RNA sequencing results with the two PRM experiments, respectively. Pearson correlation was calculated using the GraphPad software
Fig. 6
Fig. 6
Proposed action of AR in the AR+ER+BCa cell line, BT474. Treatment of BT474 cells with the androgen DHT caused upregulation of known and unknown A-regulated genes, including genes related to fatty acid metabolism and tumor-suppressor genes, such as ZBTB16 and CLDN8. At the same time, AR suppressed directly or indirectly the expression of genes related to various pathways, such as WNT signaling, and ER-responsive pathways, resulting in decreased cell proliferation and tumor growth. Boxes in red and blue color represent upregulated and downregulated pathways, respectively

Similar articles

Cited by

References

    1. American Cancer Society. How common is breast cancer? 2020. https://www.cancer.org/cancer/breast-cancer/about/how-common-is-breast-c.... Accessed 29 Dec 2020.
    1. Peters AA, Buchanan G, Ricciardelli C, Bianco-Miotto T, Centenera MM, Harris JM, et al. Androgen receptor inhibits estrogen receptor-alpha activity and is prognostic in breast cancer. Cancer Res. 2009;69:6131–6140. doi: 10.1158/0008-5472.CAN-09-0452. - DOI - PubMed
    1. Need EF, Selth LA, Harris TJ, Birrell SN, Tilley WD, Buchanan G. Research resource: interplay between the genomic and transcriptional networks of androgen receptor and estrogen receptor alpha in luminal breast cancer cells. Mol Endocrinol. 2012;26:1941–1952. doi: 10.1210/me.2011-1314. - DOI - PMC - PubMed
    1. Rahim B, O'Regan R. AR signaling in breast cancer. Cancers. 2017 doi: 10.3390/cancers9030021. - DOI - PMC - PubMed
    1. Cochrane DR, Bernales S, Jacobsen BM, Cittelly DM, Howe EN, D'Amato NC, et al. Role of the androgen receptor in breast cancer and preclinical analysis of enzalutamide. Breast Cancer Res. 2014;16:R7. doi: 10.1186/bcr3599. - DOI - PMC - PubMed