. 2022 May 14;19(1):111.
doi: 10.1186/s12974-022-02463-5.

Epigenetic regulation of innate immune memory in microglia

Affiliations

Epigenetic regulation of innate immune memory in microglia

Xiaoming Zhang et al. J Neuroinflammation. .

Abstract

Background: Microglia are the tissue-resident macrophages of the CNS. They originate in the yolk sac, colonize the CNS during embryonic development and form a self-sustaining population with limited turnover. A consequence of their relative slow turnover is that microglia can serve as a long-term memory for inflammatory or neurodegenerative events.

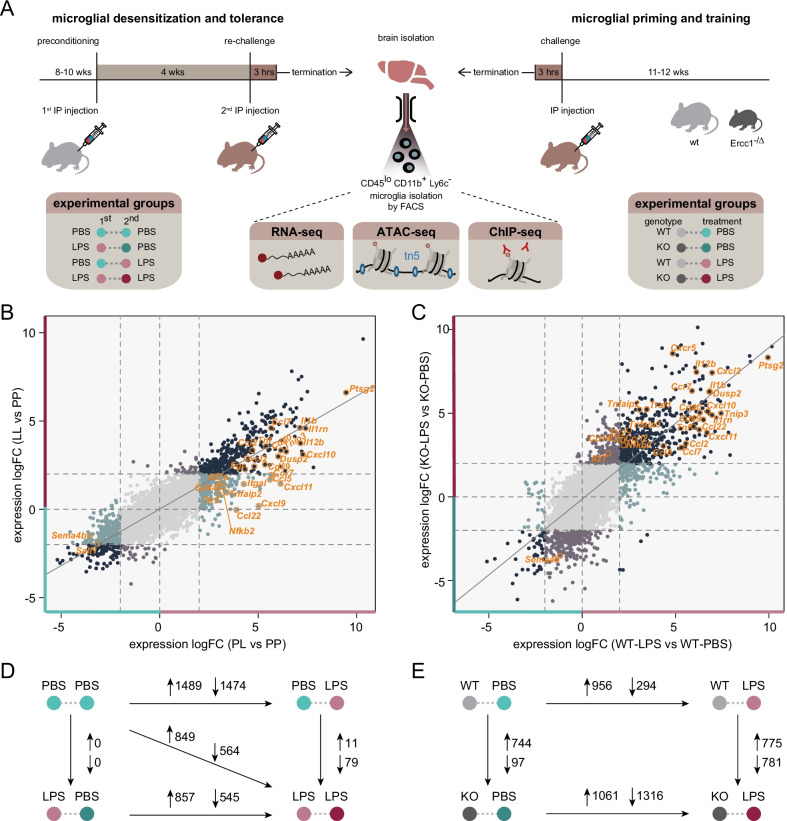
Methods: Using ATAC-, ChIP- and RNA-sequencing, we characterized the epigenomes and transcriptomes of FACS-purified microglia from mice exposed to different stimuli. A repeated endotoxin challenge (LPS) was used to induce tolerance in microglia, while genotoxic stress (DNA repair deficiency-induced accelerated aging through Ercc1 deficiency) resulted in primed (hypersensitive) microglia.

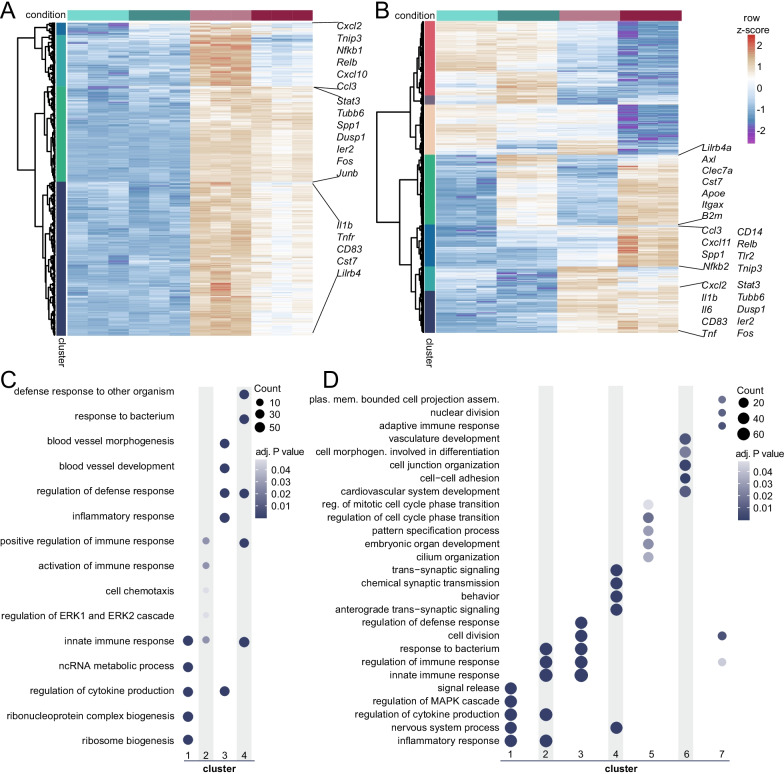
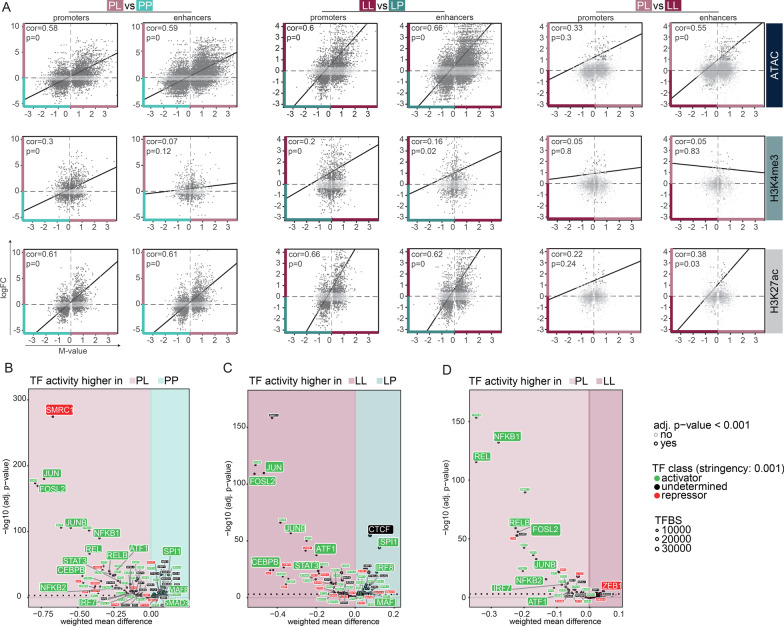
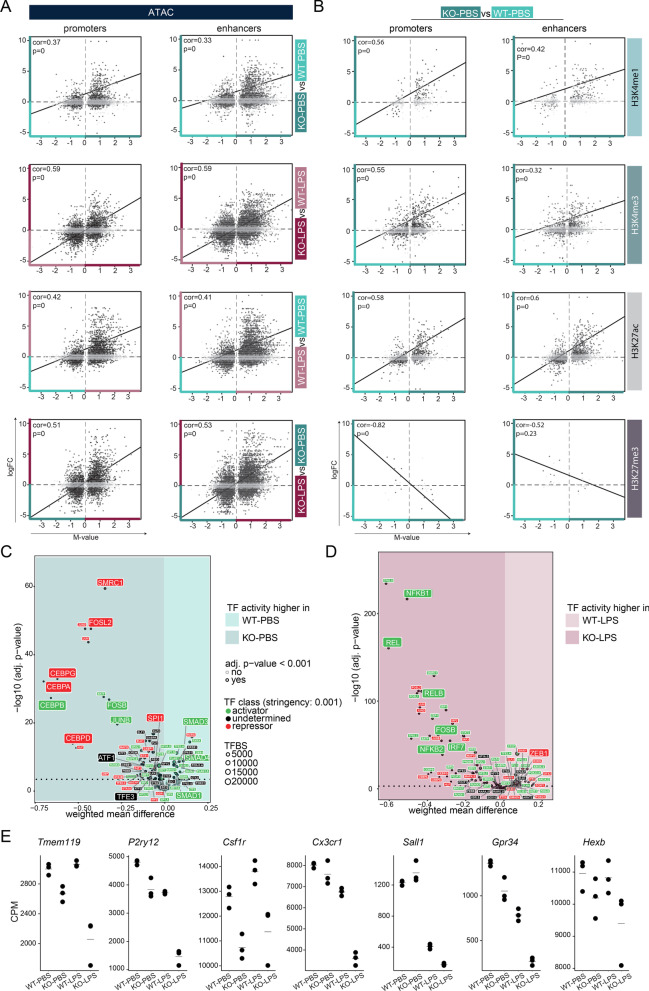
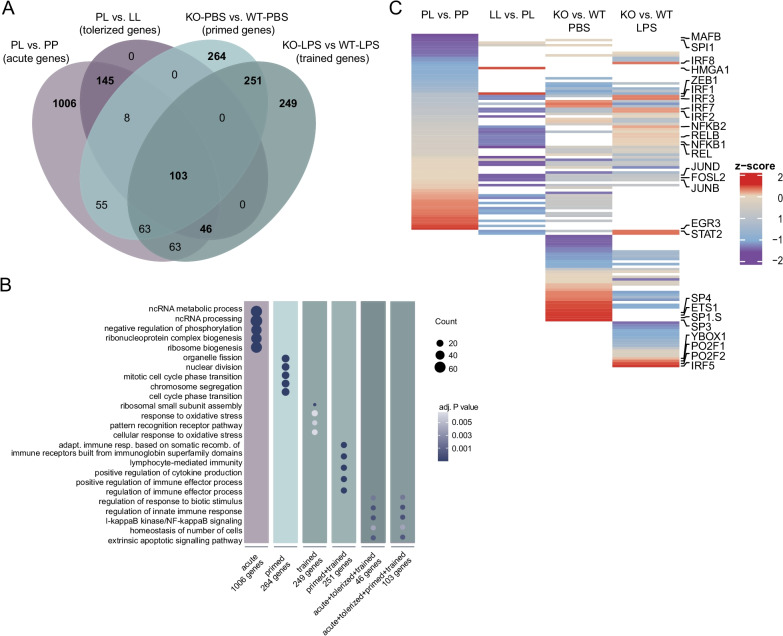
Results: Whereas the enrichment of permissive epigenetic marks at enhancer regions could explain training (hyper-responsiveness) of primed microglia to an LPS challenge, the tolerized response of microglia seems to be regulated by loss of permissive epigenetic marks. We identify that inflammatory stimuli and accelerated aging as a result of genotoxic stress activate distinct gene networks. These gene networks and associated biological processes are partially overlapping, which is likely driven by specific transcription factor networks, resulting in altered epigenetic signatures and distinct functional (desensitized vs. primed) microglia phenotypes.

Conclusion: This study provides insight into epigenetic profiles and transcription factor networks associated with transcriptional signatures of tolerized and trained microglia in vivo, leading to a better understanding of innate immune memory of microglia.

Keywords: Chromatin; Innate immunity; Microglia; Neuroinflammation; Priming; Tolerance.


Conflict of interest statement

The authors declare that they have no competing interests.

Figures

Fig. 1
Fig. 1
LPS desensitization and accelerated aging result in distinct changes of the microglia immune response. a Graphic representation of the mouse models and treatment groups. A pure microglia population was isolated by FACS and subjected to RNA, ATAC, and ChIP-sequencing analysis. b, c Four-way plots depicting changes in gene expression in microglia isolated from LPS-injected naive and pre-conditioned mice (n = 3 per experimental condition) (b) and Ercc1Δ/ko and control mice (n = 3 per experimental condition) (c). Every gene is represented by an individual dot. Differentially expressed genes (LogFC > 2) are labeled with different colors indicating their respective expression changes. Dark blue dots indicate genes differentially expressed in both comparisons; turquoise (PL versus PP and WT-LPS versus WT-PBS) and lavender (LL versus PP and KO-LPS versus KO-PBS) dots represent genes differentially expressed in one of the comparisons. Several relevant genes are highlighted. d, e The number of differentially expressed genes (LogFC > 1 and FDR < 0.01) between treatment groups in the endotoxin tolerance (d) and Ercc1Δ/ko-induced microglia priming models (e). Upward arrows indicate increased gene expression, downward arrows indicate decreased gene expression in the condition where the large arrow points to
Fig. 2
Fig. 2
Identification of gene clusters with distinct transcriptional programs in desensitized and primed microglia. a, b Heatmaps with Manhattan distance-based hierarchical clustering analysis of upregulated genes in response to LPS in microglia of C57/BL6 mice three hours after i.p. injection with LPS (LogFC > 1 and FDR < 0.01, PL versus PP). Four main clusters are identified, containing tolerized genes (cluster 2 and 4) and responsive genes (cluster 1 and 3) that show distinct activity to LPS re-stimulation. b Heatmap with Manhattan distance-based hierarchical clustering analysis of all genes differentially expressed between Ercc1Δ/ko (KO) and Ercc1wt/ko, Ercc1wt/Δ, Ercc1wt/wt (WT) mice with or without LPS injection (n = 3 per experimental condition). Seven clusters are identified, including two clusters of genes primed and trained to LPS treatment in KO mice (cluster 3 and 2). c, d Top 5 GO annotations, based on gene count per GO term, of responsive (cluster 1, 3) and tolerized (cluster 2, 4) gene clusters (c) and the 7 clusters identified in Ercc1Δ/ko microglia (d).
Fig. 3
Fig. 3
The LPS response in naive and desensitized microglia is defined by enhancer signatures of transcriptional permissive marks. a Scatterplots depicting the correlation of differentially expressed genes (logFC) with corresponding differential ATAC, H3K4me3 or H3K27ac peaks (M-value) at promoters (within 2 kb of the nearest TSS) or enhancers (distal to promoters) between PL versus PP (left panel), LL versus LP (middle panel), PL versus LL (right panel). Each dot represents a differentially expressed gene that is associated with a significant differential chromatin peak (FDR < 0.0)1 in the given comparison. Light gray-colored dots indicate non-significant gene expression differences (FDR > 0.01). b–d Transcription factor binding site analysis generated by diffTF to identify critical regulators for different gene sets based on ATAC- and RNA-seq data. Volcano plots depicting weighted mean difference of accessible TFBS between PL versus PP (b), LL versus LP (c), or PL versus LL (d). The color of each TF indicates its classification into an activator (green), a repressor (red) or undetermined (black) based on correlation of TFBS accessibility with RNA expression of the TF. FC fold change, TF transcription factor, TFBS transcription factor binding site
Fig. 4
Fig. 4
Enhancer and promoter signatures of transcriptional permissive marks regulate training in primed microglia. a, b Scatterplots depicting the correlation of differentially expressed genes (logFC) with corresponding differential ATAC peaks (M-value) in KO versus WT, LPS-treated KO versus LPS-treated WT, LPS-treated WT versus WT and LPS-treated KO versus KO microglia (a), and differential H3K4me1, H3K4me3, H3K27ac or H3K27me3 peaks (M-value) in KO versus WT microglia (b). The chromatin peaks are divided into promoters (within 2 kb of the nearest TSS) and enhancers (distal to promoters). Each dot represents a differentially expressed gene that is associated with a significantly differential chromatin peak (FDR < 0.01) in the given comparison. Gray color of dots indicates non-significant gene expression differences (logFC > 1, FDR > 0.01). c, d Transcription factor binding site analysis generated by diffTF to identify critical regulators for different gene sets based on ATAC- and RNA-seq data. Volcano plots depicting weighted mean difference of accessible TFBS between KO-PBS versus WT-PBS (c) and KO-LPS versus WT-LPS (d) microglia. The color of each TF indicates its classification into activator (green), repressor (red) or undetermined (black) based on correlation of TFBS accessibility with RNA expression of the TF. e Gene expression values (CPM, Additional file 6) of selected homeostatic microglia genes in the primed mouse model. Every dot depicts an individual animal (n = 3 per experimental condition). CPM counts per million reads, TF transcription factor, TFBS transcription factor binding site
Fig. 5
Fig. 5
Inflammatory genes show distinct epigenetic regulation in ‘acute’, ‘tolerant’, ‘primed’ and ‘trained’ microglia. a Venn diagram of the enriched genes in acute (PL versus PP, light purple, Additional file 5), tolerized (clusters 2 and 4, dark purple, Additional file 7), primed (KO-PBS versus WT-PBS, mint, Additional file 6) and trained (KO-LPS versus WT-LPS, dark mint, Additional file 6) microglial response. b Dotplot depicting the GO terms associated with unique and overlapping gene sets of acute, tolerant, primed and trained microglia. The size of the dot represents the gene count per GO term and the color indicates the adjusted P-value. c Heat map depicting row z-scores of weighted mean differences (adjusted P value < 0.001) of ATAC peaks at loci of specific TF motifs in the indicated comparisons identified with diffTF (based on Figs. 3B, D, 4C, D; Additional files 10, 12). Only accessible TF motifs of activating, repressing and undetermined TF are displayed (not-expressed TFs were filtered out). White space indicates non-significant weighted mean differences of ATAC peaks at the given locus and/or not-expressed TFs in the indicated comparison.

References

    1. Prinz M, Erny D, Hagemeyer N. Ontogeny and homeostasis of CNS myeloid cells. Nat Immunol. 2017;18:385–392. doi: 10.1038/ni.3703. - DOI - PubMed
    1. Neher JJ, Cunningham C. Priming microglia for innate immune memory in the brain. Trends Immunol. 2019;40:358–374. doi: 10.1016/j.it.2019.02.001. - DOI - PubMed
    1. Netea MG, Quintin J, Van Der Meer JWM. Trained immunity: a memory for innate host defense. Cell Host Microbe. 2011;9:355–361. doi: 10.1016/j.chom.2011.04.006. - DOI - PubMed
    1. Biswas SK, Lopez-Collazo E. Endotoxin tolerance: new mechanisms, molecules and clinical significance. Trends Immunol. 2009;30:475–487. doi: 10.1016/j.it.2009.07.009. - DOI - PubMed
    1. Saeed S, Quintin J, Kerstens HHD, Rao NA, Aghajanirefah A, Matarese F, et al. Epigenetic programming of monocyte-to-macrophage differentiation and trained innate immunity. Science. 2014;345:1251086. doi: 10.1126/science.1251086. - DOI - PMC - PubMed