. 2022 May 14;12(1):60.
doi: 10.1186/s13578-022-00798-3.

m6A demethylase FTO promotes tumor progression via regulation of lipid metabolism in esophageal cancer

Affiliations

m6A demethylase FTO promotes tumor progression via regulation of lipid metabolism in esophageal cancer

Xiaoran Duan et al. Cell Biosci. .

Abstract

Background: Epitranscriptomics studies have contributed greatly to the development of research on human cancers. In recent years, N6-methyladenosine (m6A), an RNA modification on the N-6 position of adenosine, has been found to play a potential role in epigenetic regulation. Therefore, we aimed to evaluate the regulation of cancer progression properties by m6A.

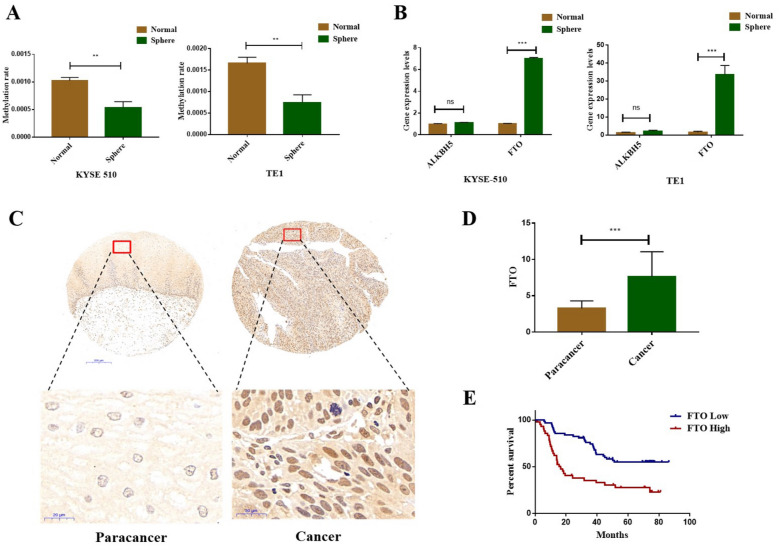
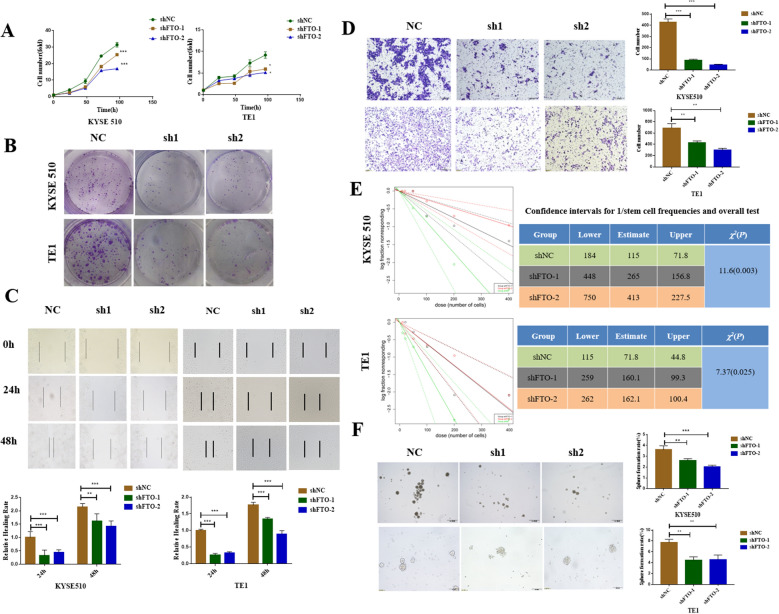
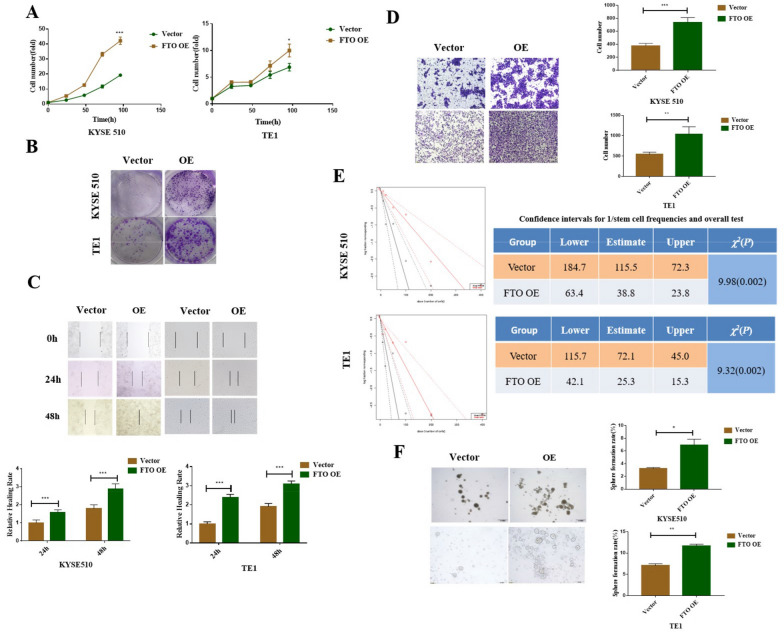
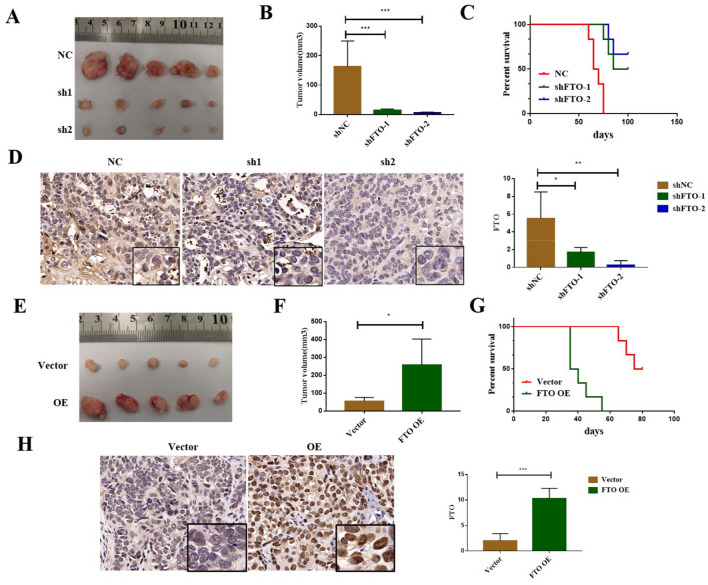
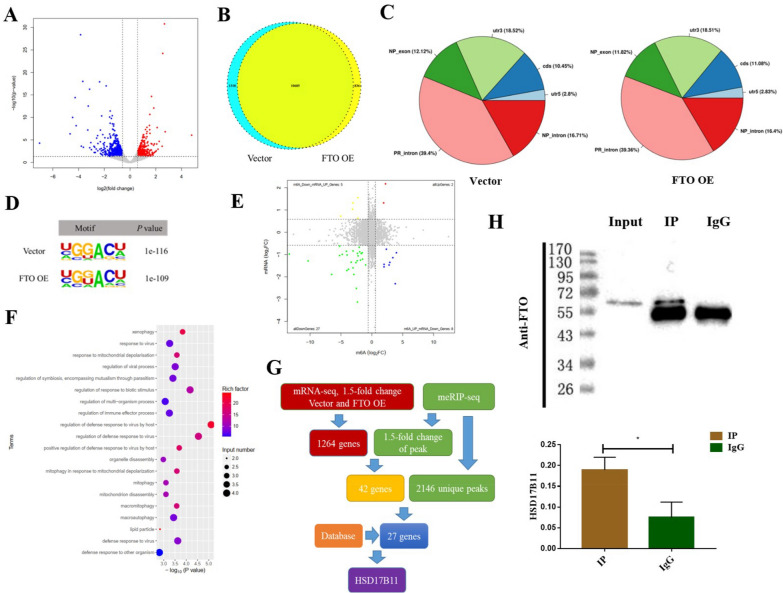
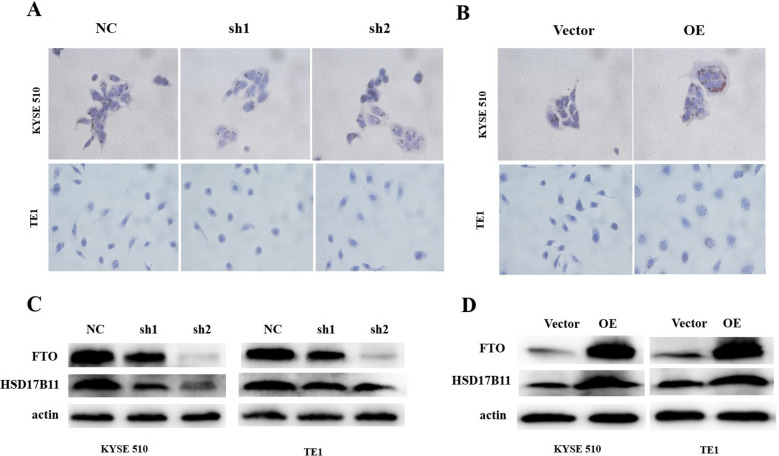
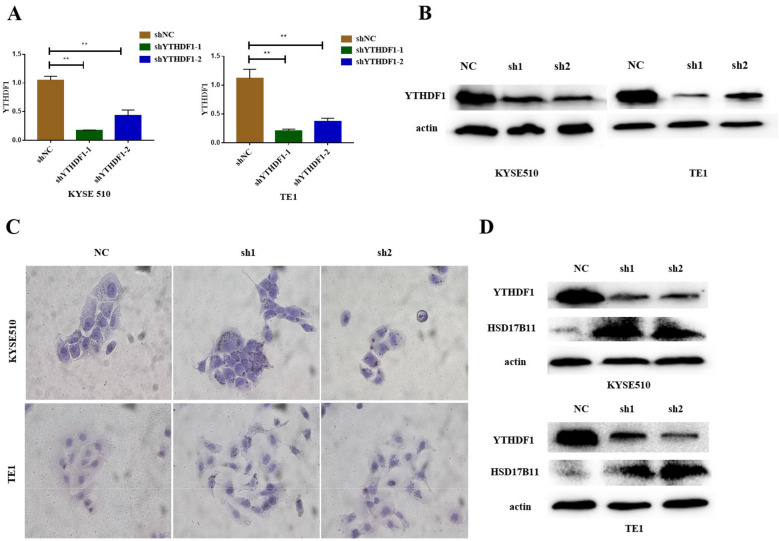
Results: We found that m6A demethylase fat mass and obesity-associated protein (FTO) was highly expressed in esophageal cancer (EC) stem-like cells, and that its level was also substantially increased in EC tissues, which was closely correlated with a poor prognosis in EC patients. FTO knockdown significantly inhibited the proliferation, invasion, stemness, and tumorigenicity of EC cells, whereas FTO overexpression promoted these characteristics. Furthermore, integrated transcriptome and meRIP-seq analyses revealed that HSD17B11 may be a target gene regulated by FTO. Moreover, FTO promoted the formation of lipid droplets in EC cells by enhancing HSD17B11 expression. Furthermore, depleting YTHDF1 increased the protein level of HSD17B11.

Conclusions: These data indicate that FTO may rely on the reading protein YTHDF1 to affect the translation pathway of the HSD17B11 gene to regulate the formation of lipid droplets in EC cells, thereby promoting the development of EC. The understanding of the role of epitranscriptomics in the development of EC will lay a theoretical foundation for seeking new anticancer therapies.

Keywords: Demethylase FTO; Esophageal cancer; Lipid Metabolism; m6A.


Conflict of interest statement

The authors declare that they have no conflicts of interest.

Figures

Fig. 1
Fig. 1
FTO is elevated in esophageal cancer stem-like cells and is a poor prognostic factor in EC patients. A EpiQuik m6A RNA Methylation Quantification kit (Colorimetry) was used to detect the total methylation levels of mRNA extracted from normal or sphere cells; B qPCR analysis of ALKBH5 and FTO mRNA expression levels between normal and sphere cells; C Immunohistochemical analysis of FTO protein in paracancerous and cancer tissues of EC patients; D Statistical results of the FTO protein levels in paracancerous and cancer tissues of EC patients (t=11.27, P < 0.001); E Kaplan-Meier survival curve was used to analyze the overall patient survival in groups with a high and low FTO expression. Log-rank test was used to compare the median overall survival duration between the two groups (x2=15.233, P < 0.001).
Fig. 2
Fig. 2
FTO inhibition decreases the proliferation, migration, and stemness of ECCs. A CCK-8 assay was used to detect the cell proliferation in ECCs with or without FTO knockdown; B Cell colony formation was used to detect the long-term proliferation of ECCs with or without FTO knockdown; C Cell migration results of wound-healing assays, and the D Transwell assay performed using ECCs with or without FTO knockdown and the respective statistical results; E Using extreme limiting dilution assay analysis, the frequency of stem cells in each group was estimated with 95% confidence intervals, and the differences among the groups were analyzed using chi-square test; F Sphere formation ability of shFTO and shNC ECCs, the histograms on the right represent the statistical results. *P < 0.05, **P < 0.01, ***P < 0.001.
Fig. 3
Fig. 3
FTO overexpression promotes the proliferation, migration, and stemness of ECCs. A CCK-8 assay was used to detect cell proliferation of ECCs in the negative control and FTO overexpression groups; B Cell colony formation assays were used to detect the long-term proliferation of ECCs in the negative control and FTO overexpression groups; C Cell migration results of wound-healing assays, and the D Transwell assay in the negative control and FTO overexpression groups and the respective statistical results; E Using extreme limiting dilution assay analysis, the FTO overexpression group was shown to have an increased spheroidization ability compared to the control group; the frequency of stem cells in each group was estimated using 95% confidence intervals, and the difference between the two groups was analyzed using chi-square test; F Sphere formation ability of FTO OE and vector ECCs, the histograms on the right represent the statistical results. *P < 0.05,**P < 0.01, ***P < 0.001.
Fig. 4
Fig. 4
The FTO expression level influences the tumorigenesis of ECCs in vivo. A Representative images of subcutaneous tumors in immunodeficient Balb/c nude mice with shNC and shFTO ECCs; B Statistical results of the tumor volumes among the three groups; C Survival analysis of mice subcutaneously injected with the ECCs with or without FTO knockdown (x2=18.528,P < 0.001);D Immunohistochemical detection of the FTO expression levels in subcutaneous tumors with or without FTO knockdown and statistical results; E Representative images of the subcutaneous tumors in immunodeficient Balb/c nude mice with FTO OE and vector ECCs; F Statistical results of the tumor volumes between the negative control and FTO overexpression groups; G Survival analysis of the mice subcutaneously injected with the esophageal cancer cell lines with FTO OE and vector (x2=12.429, P < 0.001); H Immunohistochemical detection of the FTO expression levels in the subcutaneous tumors derived from the injection of the negative control and FTO overexpression into mice and statistical results; *P < 0.05, **P < 0.01, ***P < 0.001.
Fig. 5
Fig. 5
Analysis of the downstream targets of FTO in ECCs. A Volcano map of the gene expression from UID mRNA-seq data between the negative control and FTO overexpression groups; The abscissa: log2 (fold change); the ordinate: − log10 (p-value); Gray dots represent the genes that were not differentially expressed; the blue dots represented the genes that were differentially down-regulated, and the red dots represented the genes that were differentially up-regulated; B Venn diagram of the peak associated genes of meRIP-seq data between the negative control and FTO overexpression groups; C The distribution of the peaks in each functional area of the gene; D Top consensus motif identified by HOMER with meRIP-seq peaks in ECCs with or without FTO overexpression; E Four-quadrant diagram of the meRIP-seq differential genes and mRNA-seq differential genes; F GO Analysis for the genes with reduced methylation and mRNA levels. G Schematic diagram of the screening of downstream target genes; H RNA Immunoprecipitation assay was used to detect the binding between HSD17B11 and FTO protein in KYSE510 cells (The upper band is the targeted band, and the lower band is the antibody heavy chain), and statistical results.
Fig. 6
Fig. 6
FTO influences the tumor lipid metabolism by regulating the HSD17B11 expression level. A Oil red O staining method was used to detect the lipid droplets in the ECCs with or without FTO knockdown; B Representative pictures of the lipid droplets in the ECCs with or without FTO overexpression; C Western blotting of HSD17B11 in the ECCs with or without FTO knockdown, actin served as an internal control; D Western blotting of HSD17B11 in ECCs with or without FTO overexpression.
Fig. 7
Fig. 7
FTO regulates lipid metabolism by relying on YTHDF1 protein. A qPCR analysis of the knockdown efficiency of YTHDF1 gene in ECCs; B Western blotting of YTHDF1 knockdown efficiency; C Oil red O staining method was used to detect the lipid droplets in the ECCs with or without YTHDF1 knockdown; D Western blotting of HSD17B11 in the ECCs with or without YTHDF1 knockdown.

Similar articles

Cited by

References

    1. He L, Li H, Wu A, Peng Y, Shu G, Yin G. Functions of N6-methyladenosine and its role in cancer. Mol Cancer. 2019;18:176. doi: 10.1186/s12943-019-1109-9. - DOI - PMC - PubMed
    1. Zhao Y, Shi Y, Shen H, Xie W. m6A-binding proteins: the emerging crucial performers in epigenetics. J Hematol Oncol. 2020;13:35. doi: 10.1186/s13045-020-00872-8. - DOI - PMC - PubMed
    1. Tang B, Yang Y, Kang M, Wang Y, Bi Y, He S, Shimamoto F. m6A demethylase ALKBH5 inhibits pancreatic cancer tumorigenesis by decreasing WIF-1 RNA methylation and mediating Wnt signaling. Mol Cancer. 2020;19:3. doi: 10.1186/s12943-019-1128-6. - DOI - PMC - PubMed
    1. Chen S, Yang C, Wang ZW, Hu JF, Pan JJ, Liao CY, Zhang JQ, Chen JZ, Huang Y, Huang L, Zhan Q, Tian YF, Shen BY, Wang YD. CLK1/SRSF5 pathway induces aberrant exon skipping of METTL14 and Cyclin L2 and promotes growth and metastasis of pancreatic cancer. J Hematol Oncol. 2021;14:60. doi: 10.1186/s13045-021-01072-8. - DOI - PMC - PubMed
    1. Tan F, Zhao M, Xiong F, Wang Y, Zhang S, Gong Z, Li X, He Y, Shi L, Wang F, Xiang B, Zhou M, Li Y, Li G, Zeng Z, Xiong W, Guo C. N6-methyladenosine-dependent signalling in cancer progression and insights into cancer therapies. J Exp Clin Cancer Res: CR. 2021;40:146. doi: 10.1186/s13046-021-01952-4. - DOI - PMC - PubMed

LinkOut - more resources